Download
1 / 25
250 likes | 256 Vues
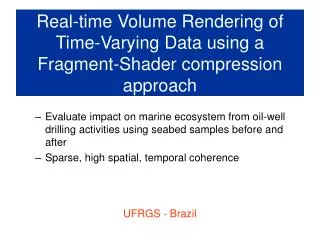
This paper presents a multiresolution volume rendering framework for visualizing large-scale time-varying data. The framework utilizes a wavelet-based time-space partitioning tree to organize the data and allows for error-controlled parallel rendering. The algorithm flow, data representation, data distribution, and run-time rendering process are explained in detail. The performance of the framework is evaluated using different datasets and wavelet transforms on a PC cluster. The results show that the framework achieves high parallel CPU utilization and rendering balance.

E N D
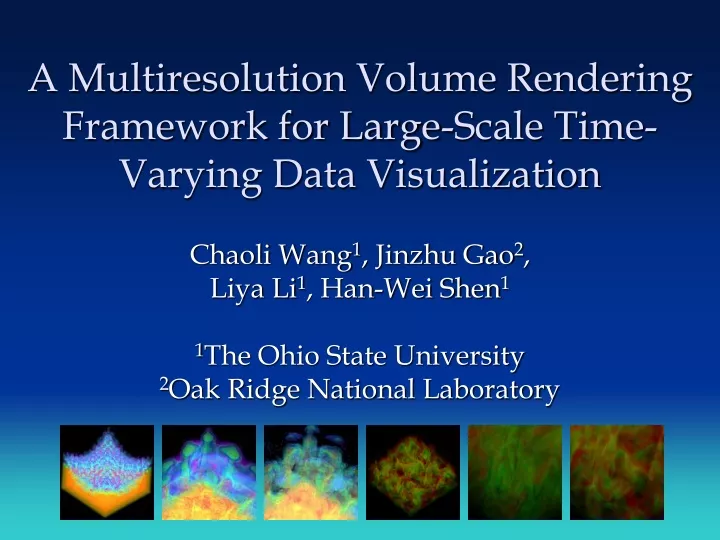
A Multiresolution Volume Rendering Framework for Large-Scale Time-Varying Data Visualization Chaoli Wang1, Jinzhu Gao2, Liya Li1, Han-Wei Shen1 1The Ohio State University 2Oak Ridge National Laboratory
Introduction • Large-scale numerical simulation • Richtmyer-Meshkov Instability (RMI) data @ LLNL • 2,048 * 2,048 * 1,920 grid • 960 (8 * 8 * 15) nodes of the IBM-SP system • 7.5 GB per time step, output 274 time steps • Goal • Data exploration • Quick overview, detail on demand • Approach • Multiresolution data representation • Error-controlled parallel rendering
Challenge • Compact hierarchical data representation • Allow specifying different spatial and temporal resolutions for rendering • Long chains of parent-child node dependency • Data dependency among processors • Balance the workload for parallel rendering
Algorithm Overview The algorithm flow for large-scale time-varying data visualization
Wavelet-Based Time Space Partitioning Tree • The WTSP tree • Space-time hierarchical data structure to organize time-varying data • An octree (spatial hierarchy) of binary trees (temporal hierarchy) • Originate from the TSP tree [Shen et al. 1999] • Borrow the idea of the wavelet tree [Guthe et al. 2002]
Wavelet-Based Time Space Partitioning Tree • WTSP tree construction • Two-stage block-wise wavelet transform and compression process • Build a spatial hierarchy in the form of an octree for each time step • Merge the same octree nodes across time into binary time trees
Hierarchical Spatial and Temporal Error Metric se(T) = Σi=0..7MSE(T, Ti) + MAX{se(Ti)|i=0..7} • Based on MSE calculation • Compare the error of each block with its children te(T) = MSE(T, Tl) + MSE(T, Tr) + MAX{te(Tl), te(Tr)}
Storing Reconstructed Data for Space-Time Tradeoff • Alleviate data dependency • EVERY-K scheme ho = 6, ht = 4 ko = 2, kt = 2
WTSP Tree Partition and Data Distribution • Eliminate dependency among processors • Distribution units ho = 6, ht = 4 ko = 2, kt = 2
WTSP Tree Partition and Data Distribution • Space-filling curve traversal • Neighboring blocks of similar spatial-temporal resolution should be evenly distributed to different processors • Space-filling curve preserves locality, always visits neighboring blocks first • Traverse the volume to create a one-dimensional ordering of the blocks
WTSP Tree Partition and Data Distribution • Error-guided bucketization • Data blocks with similar spatial and temporal errors should be distributed to different processors • Create buckets with different spatial-temporal error intervals
WTSP Tree Partition and Data Distribution • Error-guided bucketization • Bucketize the distribution units when performing hierarchical space-filling curve traversals • Distribute units in each bucket in a round-robin fashion
Run-Time Rendering • WTSP tree traversal • User specifies time step and tolerances of both spatial and temporal errors • Traverse octree skeleton and the binary time trees for each encountered octree node • A sequence of data blocks is identified in back-to-front order for rendering
Run-Time Rendering • Data block reconstruction • Get low-pass filtered subblock from its parent node • Decode high-pass filtered wavelet coefficients • Perform inverse 3D wavelet transform • Reduce reconstruction time from O(c1ho + c2hoht) to O(c1ko + c2kokt), where • c1 = time to perform an inverse 3D wavelet transform • c2 = time to perform an inverse 1D wavelet transform • ho = the height of the octree • ht = the height of the time tree • ko = # of levels in an octree node group • kt = # of levels in a time tree node group
Run-Time Rendering • Parallel Volume Rendering • Each processor renders the data blocks identified by the WTSP tree traversal and assigned to it during the data distribution stage • Cache reconstructed data for subsequent frames • Screen tiles partition • Image composition
Results • Data sets and wavelet transforms
Results • Testing environment • A PC cluster consisting of 32 2.4 GHz Pentium 4 processors connected by Dolphin networks • Performance • Software raycasting • 96.53% parallel CPU utilization, or a speedup of 30.89 times for 32 processors
Results • Data distribution with EVERY-K scheme (ko = 2, kt = 2) RMI data set SPOT data set
Results • Rendering balance result RMI data set SPOT data set
Results • The timing result with 5122 output image resolution
Results • Rendering of RMI data set at selected time steps 1st 536 8th 743 15th 1,317 32th 1,625
Results • Rendering of SPOT data set at selected time steps 1st 2,558 12th 2,743 21th 2,392 30th 2,461
Results • Multiresolution volume rendering RMI data set, 11th time step SPOT data set, 5th time step
Conclusion & Future Work • Multiresolution volume rendering framework for large-scale time-varying data visualization • Hierarchical WTSP tree data representation • Data partition and distribution scheme • Parallel volume rendering algorithm • Future work • Utilize graphics hardware for wavelet reconstruction and rendering speedup • Incorporate optimal feature-preserving wavelet transforms for feature detection
Acknowledgements • Funding agencies • NSF ITR grant ACI-0325934 • NSF Career Award CCF-0346883 • DOE Early Career Principal Investigator Award DE-FG02-03ER25572 • Data sets • Mark Duchaineau @ LLNL • John Clyne @ NCAR • Testing environment • Jack Dongarra and Clay England @ UTK • Don Stredney and Dennis Sessanna @ OSC