Download
1 / 5
50 likes | 61 Vues
4.2 Binomial Distributions. Important Concepts Binomial Experiment Binomial Probability Formula Mean (or Expected Value), Variance, and Standard Deviation of a Binomial Random Variable. 4.2 Binomial Distributions. So what exactly is a Binomial Experiment?

E N D
4.2 Binomial Distributions • Important Concepts • Binomial Experiment • Binomial Probability Formula • Mean (or Expected Value), Variance, and Standard Deviation of a Binomial Random Variable
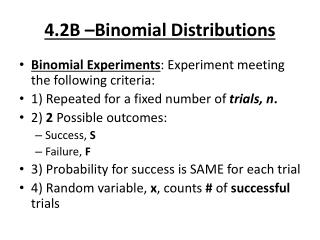
4.2 Binomial Distributions • So what exactly is a Binomial Experiment? • A probability experiment that satisfies the following four conditions: • The experiment is repeated for a fixed number of trials, where each trial is independent of the other trials. • There are only two possible outcomes of interest for each trial (either a success, S, or a failure, F). • The probability of a success is the same for each trial. • The random variable X counts the number of successful trials.
4.2 Binomial Distributions • #16 p. 211 (Childhood Obesity) • We’ll start with 3 U.S. adults instead of 6. • Binomial Probability Formula valid for x = 0,1,2,…,n • #16 p. 211 Let’s work with all 6 adults this time.
4.2 Binomial Distributions • Mean, Variance, and Standard Deviation of a Binomial Random Variable: • Good news! We do not have to build tables like we did in the last section to find these parameters. We can use formulas!
4.2 Binomial Distributions • #29 p. 212 (Life on Mars) • We could also construct a probability histogram for this binomial random variable. Since p < 0.50, we would expect the graph to be skewed to the right.