Download
1 / 40
400 likes | 502 Vues
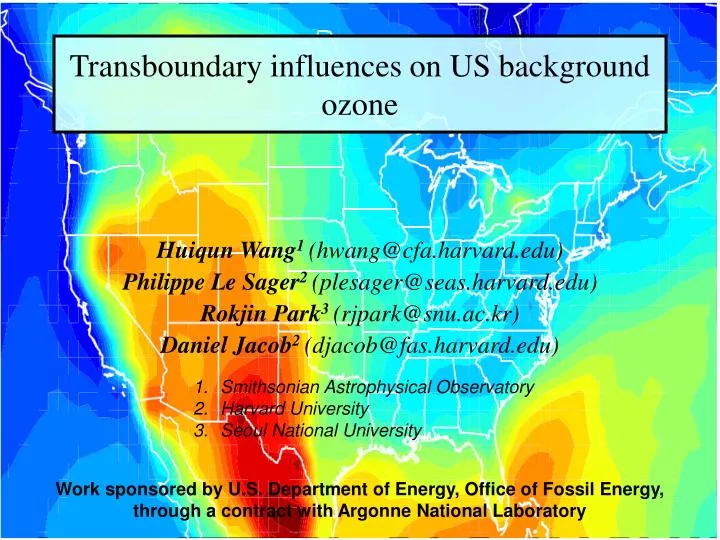
Transboundary influences on US background ozone. Huiqun Wang 1 (hwang@cfa.harvard.edu) Philippe Le Sager 2 (plesager@seas.harvard.edu) Rokjin Park 3 (rjpark@snu.ac.kr) Daniel Jacob 2 (djacob@fas.harvard.edu). Smithsonian Astrophysical Observatory Harvard University

E N D
Transboundary influences on US background ozone Huiqun Wang1 (hwang@cfa.harvard.edu) Philippe Le Sager2 (plesager@seas.harvard.edu) Rokjin Park3 (rjpark@snu.ac.kr) Daniel Jacob2 (djacob@fas.harvard.edu) • Smithsonian Astrophysical Observatory • Harvard University • Seoul National University Work sponsored by U.S. Department of Energy, Office of Fossil Energy, through a contract with Argonne National Laboratory
According to EPA, counties violating the current 80 ppb ozone standard are largely limited to southern California, the Northeast coastal corridor, and isolated other parts of the eastern US
EPA further shows that lowering the standard to 75 ppb or 70 ppb would significantly increase the number of counties in violation, based on current air quality data
Application of GEOS-Chem global air quality modelto quantify transboundary pollution influence • GEOS-Chem is a global model of ozone-PM chemistry using here NASA/GEOS assimilated meteorological data for 2001; horizontal resolution is 1o lat x 1o long (about 70x50 sq. mi.) • Standard simulation; compare w/ observations to assess confidence in the model • Set U.S. or N. American anthropogenic emissions to zero a quantify U.S. backgroundandNorth American background • Difference between U.S. background and North American background a Canadian+Mexican pollution enhancement (CANMEX) • (4) Set global anthropogenic emissions to zero a quantify natural background 3-D model structure
Background ozone is important for setting the standard Natural background from GEOS-Chem Data from Fiore et al. [JGR, 2003b] for the period Mar-Oct 2001 NA background from GEOS-Chem NA background from MOZART-2 CASTNet sites observations GEOS-Chem at CASTNet Background is not directly measurable and needs to be estimated from models
NA background – no anthropogenic emissions in North America US background – no anthropogenic emissions in the US The national totals of CAN and MEX are small, but there are non-negligible emission sources close to the border
NA background (without NA anthropogenic emissions) JJA 2001 mean, based on daily-8h-max US background (without US anthropogenic emissions)
Canadian and Mexican influences (ppb) (JJA mean, based on daily-8h-max) Selected rural measurement sites under CANMEX influences, avoiding mountain-top sites and sites with complex topography, traffic influence, and missing data Enhancement to NA background is found In the Northeast and Southwest US
Canadian enhancement in the Northeast (ppb) (JJA mean, based on daily-8h-max) •Rural sites under CAN influence The largest mean Canadian enhancement is 8.8 ppb (among all US grid boxes)
Mexican enhancement in the Southwest (ppb) (JJA mean, based on daily-8h-max) •Rural sites under MEX influence The largest mean Mexican enhancement is 13.1 ppb (among all US grid boxes)
Williamson Buffalo Unionville Westfield Kane Exp Forest Lykens CAN enhancement at selected sites in the Northeast close to Canadian sources Daily-8h-max time series for these six locations follow …
The largest episodic CAN enhancement at Unionville, MI (34 ppb) increases US background to 47 ppb (red circle) Measurement Std-run US-backgroundNA-backgroundCANMEX Inverted black triangles show days in which CAN enhancement is >10 ppb and observed ozone concentration is >80 ppb
Westfield, NY Measurement Std-run US-backgroundNA-backgroundCANMEX Inverted black triangles show days in which CAN enhancement is >10 ppb and observed ozone concentration is >80 ppb
Williamson, NY Measurement Std-run US-backgroundNA-backgroundCANMEX Inverted black triangles show days in which CAN enhancement is >10 ppb and observed ozone concentration is >80 ppb
Kane Exp Forest, PA Measurement Std-run US-backgroundNA-backgroundCANMEX Inverted black triangles show days in which CAN enhancement is >10 ppb and observed ozone concentration is >80 ppb
Lykens, OH Measurement Std-run US-backgroundNA-backgroundCANMEX Inverted black triangles show days in which CAN enhancement is >10 ppb and observed ozone concentration is >80 ppb
Buffalo, NY: At Buffalo, the CAN influence is frequently above 10 ppb, and US background is frequently above 30 ppb Measurement Std-run US-backgroundNA-backgroundCANMEX Inverted black triangles show days in which CAN enhancement is >10 ppb and observed ozone concentration is >80 ppb
For Buffalo, EPA has shown that Canadian sources contribute 59% to ozone precursors on peak ozone days (Slide from EPA presentation)
Williamson Buffalo Unionville Westfield Stow Kane Exp Forest Lykens Wash. Crossing Greenbelt High episodic CAN contributions are experienced as far south and east as Eastern MA, New Jersey, and the Washington DC area Daily-8h-max time series for these more distant locations follow …
Stow, MA Measurement Std-run US-backgroundNA-backgroundCANMEX Inverted black triangles show days in which CAN enhancement is >10 ppb and observed ozone concentration is >80 ppb
Washington Crossing, NJ Measurement Std-run US-backgroundNA-backgroundCANMEX Inverted black triangles show days in which CAN enhancement is >10 ppb and observed ozone concentration is >80 ppb
Greenbelt, MD Measurement Std-run US-backgroundNA-backgroundCANMEX Inverted black triangles show days in which CAN enhancement is >10 ppb and observed ozone concentration is >80 ppb
Alpine, CA: The situation in the Southwest is different from the Northeast; there is a larger mean enhancement but fewer sharp episodes. MEX influence is frequently above 10 ppb, and US background is frequently above 30 ppb Measurement Std-run US-backgroundNA-backgroundCANMEX Inverted black triangles show days in which MEX enhancement is >10 ppb and observed ozone concentration is >80 ppb
Canadian influence is >10 ppb on some peak ozone days (>80 ppb) Canadian influence is always <10 ppb on peak ozone days (>80 ppb) Untagged color boxes have max surface ozone <= 80 ppb CAN influence is important for areas near the Great Lakes and the Northeast coast Max CAN contribution on peak ozone days is 23 ppb among boxes shown as:■
Canadian influence is >10 ppb on some peak ozone days (>75 ppb) Canadian influence is always <10 ppb on peak ozone days (>75 ppb) Untagged color boxes have max surface ozone <= 75 ppb
Canadian influence is >10 ppb on some peak ozone days (>70 ppb) Canadian influence is always <10 ppb on peak ozone days (>70 ppb) Untagged color boxes have max surface ozone <= 70 ppb Note that as the reference ozone value is decreased, increasingly larger areas of the Southeast and industrial Midwest are influenced
Canadian influence is >5 ppb on some peak ozone days (>80 ppb) Canadian influence is always <5 ppb on peak ozone days (>80 ppb) Untagged color boxes have max surface ozone <= 80 ppb
Canadian influence is >5 ppb on some peak ozone days (>75 ppb) Canadian influence is always <5 ppb on peak ozone days (>75 ppb) Untagged color boxes have max surface ozone <= 75 ppb
Canadian influence is >5 ppb on some peak ozone days (>70 ppb) Canadian influence is always <5 ppb on peak ozone days (>70 ppb) Untagged color boxes have max surface ozone <= 70 ppb At CAN = >5 ppb and ozone = >70 ppb, much of the eastern US is influenced, even into North Carolina
Contribution of CAN pollution to exceedances of different levels of ozone concentration (I) Number of data points exceeding specified values of CAN enhancement and ozone concentration (cumulative) 93 50 28 Y: 527 280 138 854 2936 1679 70 75 X: Includes all US grid boxes within [36N-48N, 88W-66W] (15,180 data points) 30
Scatter plot based on timeseries at the gridboxes with Ozone > 80ppb and Canadian influence > 5ppb 71 43 28 138 359 225 1409 916 540 Contribution of CAN pollution to exceedances of different levels of ozone concentration (II) Number of data points exceeding specified values of CAN enhancement and ozone concentration (cumulative) Sorted to include only the 56 grid boxes that had at least one case of X >80 ppb and Y >5 ppb, i.e., under some Canadian influence (5,152 data points) 31
Mexican influence is >10 ppb on some peak ozone days (>80 ppb) Mexican influence is always <10 ppb on peak ozone days (>80 ppb) Untagged color boxes have max surface ozone <= 80 ppb MEX influence is important for southern California and parts of Arizona and Texas Max MEX contribution on peak ozone days is 18 ppb among boxes shown as:■
Mexican influence is >10 ppb on some peak ozone days (>75 ppb) Mexican influence is always <10 ppb on peak ozone days (>75 ppb) Untagged color boxes have max surface ozone <= 75 ppb
Mexican influence is >10 ppb on some peak ozone days (>70 ppb) Mexican influence is always <10 ppb on peak ozone days (>70 ppb) Untagged color boxes have max surface ozone <= 70 ppb
Mexican influence is >5 ppb on some peak ozone days (>80 ppb) Mexican influence is always <5 ppb on peak ozone days (>80 ppb) Untagged color boxes have max surface ozone <= 80 ppb
Mexican influence is >5 ppb on some peak ozone days (>75 ppb) Mexican influence is always <5 ppb on peak ozone days (>75 ppb) Untagged color boxes have max surface ozone <= 75 ppb
Mexican influence is >5 ppb on some peak ozone days (>70 ppb) Mexican influence is always <5 ppb on peak ozone days (>70 ppb) Untagged color boxes have max surface ozone <= 70 ppb At MEX = >5 ppb and ozone = >70 ppb, MEX influence extends into Nevada, New Mexico, and NW Texas
Contribution of MEX pollution to exceedances of different levels of ozone concentration (I) Number of data points exceeding specified values of MEX enhancement and ozone concentration (cumulative) 53 28 14 Y: 49 271 109 2453 1002 413 70 75 X: 38 Includes all US grid boxes within [26N-42N, 120W-90W] (34,960 data points)
Scatterplot based on timeseries at gridboxes with Ozone > 80 ppb & Mexican enhancement > 5 ppb Contribution of MEX pollution to exceedances of different levels of ozone concentration (II) Number of data points exceeding specified values of MEX enhancement and ozone concentration (cumulative) 14 43 27 155 90 49 379 223 125 Sorted to include only the 15 grid boxes that had at least one case of X >80 ppb and Y >5 ppb, i.e., under some Mexican influence (1,380 data points) 39
CONCLUSIONS • Transboundary pollution from Canada and Mexico increases the mean background surface ozone concentration in the US in JJA by 1-13 ppb. • The largest Canadian enhancement is 8.8 ppb (JJA mean), with an episodic maximum of 34 ppb (at Unionville, MI) in the daily-8h-max time series. • The largest Mexican enhancement is higher, 13.1 ppb (JJA mean), but the maximum in the daily-8h-max time series is smaller (21 ppb, not shown). • For peak ozone cases, the US background can be >30 ppb and even 40 ppb due to transboundary influences. • Transboundary pollution can contribute significantly (up to 23 ppb in the Northeast and 18 ppb in the Southwest) to peak ozone levels (in this case, defined as >80 ppb). • Canadian contributions on peak days (>70, > 75, or > 80 ppb ozone) can exceed 10 ppb as far from Canada as near Washington, DC; central New Jersey, and eastern Massachusetts; Mexican contributions can be consistently higher in some cases, but focused on closer areas of S. California, S. Nevada, and western to central Arizona. • Cross-border contributions of these magnitudes impose significant penalties for some regions of the country, i.e., in order to achieve a tightened ozone standard, parts of MI, NY, PA, and other Northeastern and Midwestern locations would have to get substantial additional emission reductions, depending on location, to offset the Canadian influence.