Download
1 / 16
160 likes | 358 Vues
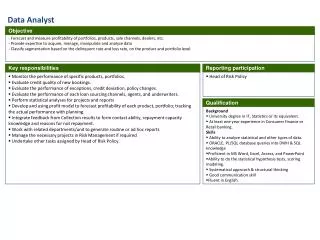
Demystifying SPSS: Tips and Tricks for Beginning and Intermediate Users 23 rd Annual Washington Assessment Conference. Andrea Meld, PhD Data Analyst, OSPI andrea.meld@k12.wa.us.

E N D
Demystifying SPSS: Tips and Tricks for Beginning and Intermediate Users23rd Annual Washington Assessment Conference Andrea Meld, PhD Data Analyst, OSPI andrea.meld@k12.wa.us
…there is an entire, yet to be fully explored universe of SPSS, especially when it comes to preparing and running syntax. “Share what you know, learn what you don’t.” Raynald Levesque, Raynald’s SPSS Tools
What is SPSS? • A comprehensive system for analyzing data. • Takes data from almost any type of file and generate tables, reports, charts, and graphs. • Can be used to produce distributions and trends, descriptive statistics, and complex statistical analysis. • Used in over 100 countries and in all 50 U.S. state governments, as well as by universities, and some of the largest U.S. newspapers, and other businesses.
What does SPSS stand for? When SPSS was founded in 1968, the developers named it "Statistical Package for the Social Sciences," or "SPSS." At first, it was used mostly in colleges and universities. SPSS is now widely used in business and other settings for various types of analysis. Today, "SPSS Inc." refers to the company and "SPSS" to the product.
Good References – Where to Go for Help Books: An Intermediate Guide to SPSS Programming: Using Syntax for Data Management, by Sarah Boslaugh, Sage, 2004. SPSS Programming and Data Management: A Guide for SPSS and SAS Users, by Raynald Levesque, SPSS, Inc., 2005. SPSS 11.5 Syntax Reference Guide, Volumes I and II, SPSS Inc., 2002.
Websites: East Carolina University: SPSS Lessons: Univariate Analysis http://core.ecu.edu/psyc/wuenschk/SPSS/SPSS-Lessons.htm SPSS Lessons: Multivariate Analysis http://core.ecu.edu/psyc/wuenschk/SPSS/SPSS-MV.htm SPSS Links: http://core.ecu.edu/psyc/wuenschk/SPSS/SPSS-MV.htm Harvard-MIT Data Center, Guide to SPSS http://www.hmdc.harvard.edu/projects/SPSS_Tutorial/ spsstut.shtml
Websites (cont.): Raynald’s SPSS Tools http://www.spsstools.net/ SPSS Homepage http://www.spss.com/corpinfo/source=homepage&hpzone=nav_bar UCLA Academic Technology Services Resources http://www.ats.ucla.edu/stat/spss/ WERA Newsletter, The Standard Deviation http://www.wera-web.org (Spring 2007)
Syntax vs. Drop-down menus(Point-and-Click) • Drop-down menus are easier to learn initially. • Adequate for every day or one-time use. • Undetected errors are more likely with menus. • Results can easily be reproduced using syntax, which is useful for work that is repeated or done on a regular basis. • Some procedures and manipulations are only available through syntax.
Syntax vs. Drop-down menus(cont.) • Syntax allows you to document your work. • Syntax can be big time saver and enhance productivity and efficiency. • It works better for complex data management and lengthy analysis. • It allows you to communicate with other SPSS users (like a universal language). Note: There are other language versions of SPSS.
Tips on Learning Syntax: • Study existing syntax created by other users. • You can cut and paste menu commands and start using these for syntax. • Save syntax that works – keep a log. • Refer to books and websites. • Share successful syntax with other users. • Capitalize commands and write variable names in lower case -- syntax will be easier to read. • Put spaces before and after slashes and apostrophes to enhance readability. • Save your syntax file frequently.
Steps in Using Syntax: • Record what you want the program to do. • Write the syntax – either in the syntax file or editor. • Run your syntax. • Check for errors in your output. • Try to fix the syntax. • Run your program again. • Repeat steps 4 – 6 until your output is error-free. • Debugging errors can take longer than writing your program
Avoiding Common Syntax Errors: • Make sure your file and path names are correct. • Avoid typing letter O instead of numeric 0 or letter l for numeric 1. Find and correct all typos and spelling errors. • Avoid long variable names – it’s easier to make typos – do use variable labels and value labels to describe your data. • Be sure to start a comment line with an asterisk (*) and end with a period (.) • Indent the second line of a command statement.
Avoiding Errors (cont.) • Close and balance all parentheses. • Use apostrophes or quotation marks to enclose string variables. • Don’t wipe out your data with “SELECT IF” statements - can happen if you misspell the selection criteria. • Close command statements with a period but don’t use a period just because you’ve come to the end of a line. • Most commands can be abbreviated to 3 or 4 letters, but don’t shorten COMP to COMP.
Further Debugging • Become familiar with your data. Run FREQUENCIES and CROSSTABS. • Check your output. If results seem too strange to be true, check your data and syntax for errors. • Use the DESCRIPTIVES command. Are min. and max. data values within the expected range? • Compare mean scores for groups. • Use IF statements to find and flag contradictions. IF absent = 1 and tested = 1 FLAG abtest = 1. FREQ abtest.
Steps in Using SPSS • Read data • Open an SPSS file • Define variables • Transform data • Save Your SPSS File
Create Graphs to Visualize Data Use menu commands or syntax to produce: • Frequency distributions • Population pyramids • Histograms • Boxplots • Scatterplots