Download
1 / 25
250 likes | 374 Vues
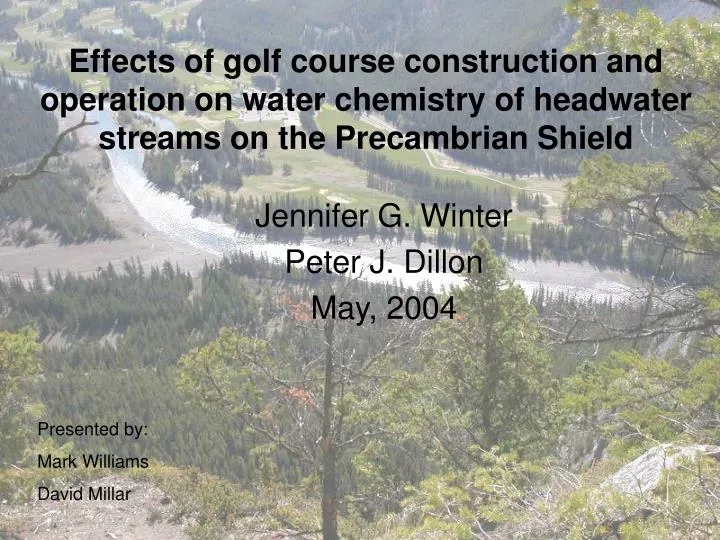
Effects of golf course construction and operation on water chemistry of headwater streams on the Precambrian Shield. Jennifer G. Winter Peter J. Dillon May, 2004. Presented by: Mark Williams David Millar. Purpose:.

E N D
Effects of golf course construction and operation on water chemistry of headwater streams on the Precambrian Shield Jennifer G. Winter Peter J. Dillon May, 2004 Presented by: Mark Williams David Millar
Purpose: To investigate the effects of golf course construction and operation on the water chemistry of Precambrian Shield streams. (Canada)
Summary • Streams were more alkaline post golf course construction • Concentrations of base cations and nitrates increased downstream of operational golf courses • Total phosphorous in the streams increased • Vegetation acting as a buffer for these substances appears to drastically reduce their concentrations if implemented near golf courses.
Background • Soils on the Shield are acidic, dolomite and limestone are commonly added to “up” the pH. • Golf course’s require that the land loose much of it’s natural ability to absorb nutrients (via deforestation), natural sinks of nitrogen and phosphorous removed • Runoff from golf courses poses a threat to water quality, as fairways, greens, and other “manicured” areas are meant to drain. (Gravel and sand is usually the foundation for topsoil, hydraulic conductivity
Seven golf courses were sampled (A-G) Stream locations unknown, as to protect golf course identity, but in vicinity of the District of Muskoka Surface geology is primarily till deposits, generally <1m thick Podzolic, brunisolic soils Courses A-E in operation from 5-10, >50 years Course F in operation since summer, 2001 Samples were collected upstream of courses A, D and E for upstream versus downstream comparisons. Three inflowing streams converged on course D. Comparisons were also made with data from 18 reference streams in undeveloped areas (watershed area > 80% forest and wetland). Site Description
Fertilizer Application Rates for Each Course Stream sites F1 – F4 showed the highest rates of Phosphorous applications 25-50 kg/ha/year, at course F
Fertilizer Application • Courses used a combination of organic or controlled and slow release nitrogen fertilizers in their applications • Course F commonly uses treated sewage effluent for irrigation, which is more than likely linked to the increase in P concentrations at the stream sampling stations. • Courses F and G also linked to higher N and K concentrations in the adjacent stream
Water Chemistry • “Grab” samples taken monthly throughout the year • Cations, anions, total phosphorus and nitrogen species were measured weekly on courses B, C and F, and on D until 2001. • Alkalinity was measured via Gran titration, pH by glass electrode, conductivity by conductivity meter, and concentrations of calcium, sodium, potassium and chloride by ion chromatography. • Nitrate, total Kjeldahl nitrogen and total phosphorus were measured colorimetrically using an autoanalyzer. Total nitrogen concentration was calculated by adding the total nitrate (nitrate + nitrite) and total Kjeldahl nitrogen concentrations together • Total P,K, nitrate, and Kjedahl N also measured in inflows/outflows of ponds adjacent to courses B,C and D
Results • Sites F3, F4 drained a larger area of Course F than F1 and F2 • Increase shown in alkalinity, conductivity, sodium, chloride, calcium and potassium when construction of the course began in 1999 • Total P concentrations higher in both streams after course remodeling and rootzone (fertilizer) application
Alkalinity, Na, Conductivity, Chloride monthly measurements for Stream F
Ca, NO3, P, and Total P concentrations in stream from course F
Total P concentration for stream/course F • P concentrations peaked during the summer months (~80 μg/L) and in the early fall in preparation for winter (~60 μg/L)
Alkalinity, Na, Conductivity, and Chloride for stream/course G
Course G • Alkalinity increased in station G1 over sampling period, >100 μeqv/L • “Mean concentrations of potassium and total phosphorus were three-fold and two-fold higher, respectively, in G1 in the summer of 2001 than in the summer of 2000, while nitrate concentrations were higher in the summer of 2000 (24% increase) and 2001 (43% increase) than in 1999”
Stream C showed the highest total P concentrations in the 1999-2000 season as well as the 2000-2001 season Note: no upstream sites were measured for these courses therefore an additional N,P,K source is possible
Stream A showed a decrease in total P past the course, yet showed a dramatic increase in nitrate concentration downstream. Courses D and E show similar results
Relationships between stream concentrations and physical variables • Various sinks for nutrients, such as vegetative covering along the streams, as well as soil type etc.. can (and do) affect stream concentrations. • Golf course variables such as playable area (fairway size), soil composition, and drainage pathways can also affect these results.
Redundancy analysis (RDA) diagram showing sample scores from the ordination of 2000–2001 hydrologic year (Mean water chemistry of streams)
RBQI: River Bank Quality Index • Measures the ability for a river to contribute to it’s own water quality, which is based on various ecological and geological controls. • Calculated by the formula: ai: the area covered by the vegetation class (i.e. forest, wetland etc., m2 Pi: a standardized weighting factor for each class of ai D:total area surveyed (m^2)
Mean 2000/01 nutrient concentrations vs. RBQI scores • “The mean 2000–2001 hydrologic year concentrations of total nitrogen and total phosphorus were significantly related to the total area of unmanaged vegetation in the 1800m^2 surrounding the sampling sites and to the RBQI score.” • “Overall, the more the unmanaged vegetation surrounding the stream site, or the higher the RBQI score, the lower the concentrations of nutrients in the stream.” (For all courses excluding D)
Conclusions • Golf course operation clearly had (has) an effect on water quality • Generally, streams were more alkaline and higher in concentrations of cations and nitrates downstream of golf courses • P and K concentrations are naturally low in Boreal forests, so elevated P and K levels indicate runoff and contamination from direct fertilization of turfgrass
Conclusions • “During construction through to operation, changes were observed in water chemistry over time in those courses that drained forested areas prior to construction. • Alkalinity, conductivity and concentrations of total phosphorus, nitrate, potassium and other ions increased in these streams over the course of the study. • The streams with minimal water chemistry changes during and after construction were those that drained a small proportion (<10%) of the golf course property (G2) or were located close to pre-existing residential development (F2).”
Conclusions • Drainage morphology and subsurface conditions play a vital role in how nutrients are leeched into groundwater and above ground streams • The River Bank Quality Index is a good indicator of how well ecological controls effect nutrient cycling in drainage areas.
Recommendations • To reduce nutrient levels in streams: 1.) fertilize as little as possible 2.) maximize the riparian zone between golf courses and streams to act as a buffer 3.) maintain stream bank conditions (thus maximizing the RBQI)