Download
1 / 15
150 likes | 244 Vues
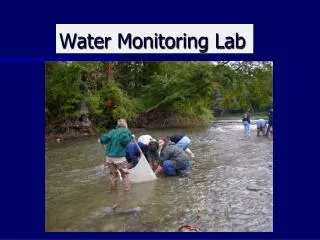
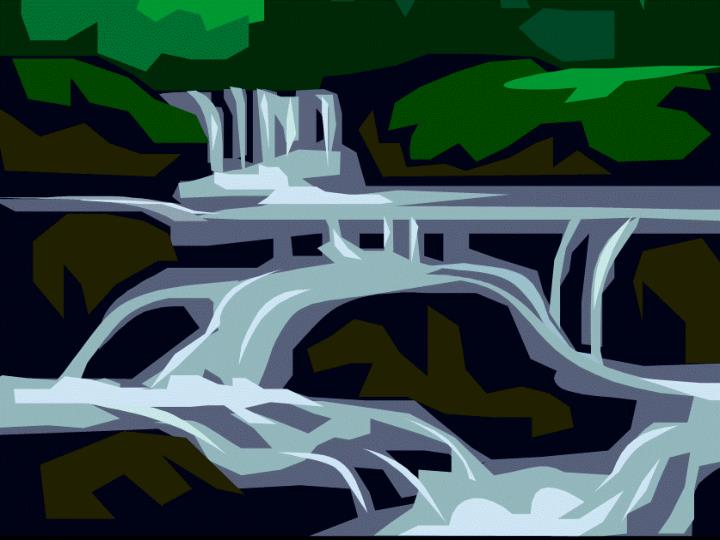
Water Assessment Data Lab. Assignment # 5. Land Use. The first thing you notice when field sampling is the area around your site. What type of land use is going on around it? What condition is it in? www.maps.google.com

E N D
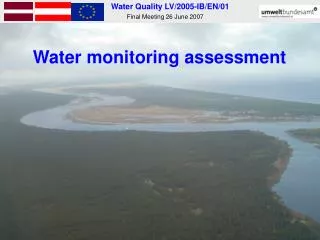
Water Assessment Data Lab Assignment # 5
Land Use • The first thing you notice when field sampling is the area around your site. What type of land use is going on around it? What condition is it in? • www.maps.google.com • Which stream do you think is going to be severely impacted and which will be non- impacted?
The Data Sheets • Data courtesy of Watershed Assessment Associates
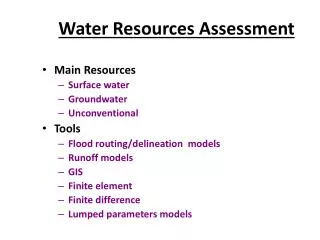
Physical Characteristics • Width, Depth, Current- affect who lives there • Substrate- particle size of the stream bottom • Embeddedness- How deeply the rocks are pushed into the stream bed
Chemical Measurements • Temp • Conductance- Indicates salts and ions • DO and %DO- • pH • Salinity
Biological Attributes • Canopy • Aquatic Vegetation • Macroinvertebrates • Faunal conditions • Observations- What other things might you want to note from your sample site?
Invert counts • This is what we are going to do for the final lab! • Genera Richness- Why would this be important? • EPT- Ephemeroptera, Plecoptera, and Trichoptera (who are highly sensitive to pollution) EPT= {(E+P+T)/ Total bugs}*100%
EPT= {(E+P+T)/ Total bugs}*100% {(11+0+78)/100}*100%= 79%
Use letter codes (A = 1-9, B = 10-99,C = 100 or more) to record the numbers of organisms. Water Quality Rating _____ Excellent ( > 22) _____ Good (17-22) __X___ Fair (11-16) _____ Poor ( < 11)
How's the water? • Put it all together! • Do you think this stream is Severely impacted, somewhat impacted or non-impacted? • Now try it on your own with the next 2 and use the questions to walk you through the analysis.