Download
1 / 26
300 likes | 682 Vues
Describing Distributions with Numbers. S.O.C.S SHAPE: approximately symmetric, left-skewed, right-skewed OUTLIER(S): list them CENTER: mean or median SPREAD: range, interquartile range, or standard deviation If you use mean for the center, then use standard deviation for the spread.

E N D
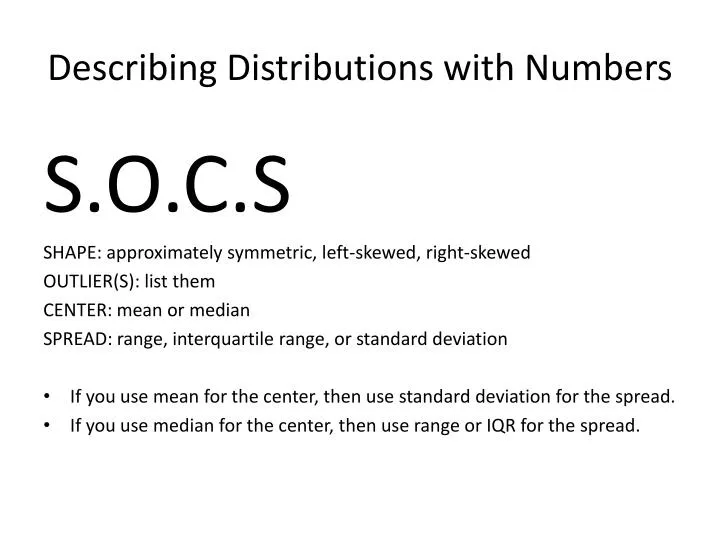
Describing Distributions with Numbers S.O.C.S SHAPE: approximately symmetric, left-skewed, right-skewed OUTLIER(S): list them CENTER: mean or median SPREAD: range, interquartile range, or standard deviation • If you use mean for the center, then use standard deviation for the spread. • If you use median for the center, then use range or IQR for the spread.
Center • Mean • Use when there is no outlier • Average • Median • Use if there is an outlier • Exact middle number of data • Be sure to put your data in ascending order 1st
The Mean (x-bar) • To find the mean of a set of n observations, x1, x2, x3, … , xn, add their values and divide by the number of observations: or S (Sigma) means sum
Example: Test scores on 2nd exam for 10 statistics students Exam scores: 80, 73, 92, 85, 75, 98, 93, 55, 80, 90 n = 10
Note: The mean is sensitive to a few extreme observations • NOT a resistant measure of center • What if there were an 11th student in the class who didn’t show up and received a 0 on the 2nd exam? • How would this affect the mean?
The Median (M) • The median is the midpoint of a distribution • Half the observations are smaller and half the observations are larger than M • To find the median: • Arrange data from smallest to largest • If the number of observations (n) is odd, M is the center observation in the ordered list, located (n+1)/2 observations up from the bottom • If the number of observations (n) is even, M is the mean of the two center observations in the ordered list. M is still located at the (n+1)/2 position
Finding the Median • Consider again exam scores for 10 students: Exam scores: 80, 73, 92, 85, 75, 98, 93, 55, 80, 90 • Arrange data from smallest to largest: 55, 73, 75, 80, 80, 85, 90, 92, 93, 98 • n = 10, so n is even and M is the mean of the • 5th and 6th observations in the ordered list. • M is located at (10+1)/2, or 5.5th position in • ordered list • M = (80+85)/2 = 82.5
The median is a more resistant measure of center than the mean. • What happens to M if we include the 11th student who received a 0 in the data set? Exam scores (in order): 0, 55, 73, 75, 80, 80, 85, 90, 92, 93, 98 • There are now 11 data points, so n = 11 and is odd • M is therefore center observation in ordered list, located in position (12+1)/2, or 6th position • M = 80
Comparing the mean and the median The mean and the median are the same only if the distribution is symmetrical. The median is a measure of center that is resistant to skew and outliers. The mean is not. Mean and median for a symmetric distribution Mean Median Mean and median for skewed distributions Mean Median Left skew Right skew Mean Median
Symmetric distribution… Disease X: Mean and median are the same. … and a right-skewed distribution Multiple myeloma: The mean is pulled toward the skew. Impact of skewed data
Conclusion for Shape (skewness) • In a symmetric distribution, the mean and median are close to each other (about equal) • Right skewed – mean is greater than median • Left skewed – mean is less than median
What should you use, when, and why? $$$ Arithmetic mean or median? • Middletown is considering imposing an income tax on citizens. City hall wants a numerical summary of its citizens’ income to estimate the total tax base. • In a study of standard of living of typical families in Middletown, a sociologist makes a numerical summary of family income in that city. • Mean: Although income is likely to be right-skewed, the city government wants to know about the total tax base. • Median: The sociologist is interested in a “typical” family and wants to lessen the impact of extreme incomes.
SPREAD • Standard Deviation – use if you use mean for the center • Range---use if you use median for the center • Interquartile Range – IQR---use if you use median for the center
Measure of spread: the quartiles The first quartile, Q1, is the value in the sample that has 25% of the data at or below it ( it is the median of the lower half of the sorted data, excluding M). The third quartile, Q3, is the value in the sample that has 75% of the data at or below it ( it is the median of the upper half of the sorted data, excluding M). Q1= first quartile = 2.2 M = median = 3.4 Q3= third quartile = 4.35
Five-number summary and boxplot Largest = max = 6.1 BOXPLOT Q3= third quartile = 4.35 M = median = 3.4 Q1= first quartile = 2.2 Five-number summary: min Q1M Q3 max Smallest = min = 0.6
Boxplots for skewed data Comparing box plots for a normal and a right-skewed distribution Boxplots remain true to the data and depict clearly symmetry or skew.
Identifying Outliers • Compare the distance from the suspicious data point to the nearest quartile (Q1 or Q3). We then compare this distance to the interquartile range (distance between Q1 and Q3). • We call an observation a suspected outlier if it falls more than 1.5 times the size of the interquartile range (IQR) above the first quartile or below the third quartile. This is called the “1.5 * IQR rule for outliers.” • Formula: The data is an outlier if it falls outside of the interval, Q1- 1.5*IQR to Q3 + 1.5*IQR. (IQR = Q3-Q1)
8 Distance to Q3 7.9 − 4.35 = 3.55 Q3 = 4.35 Interquartile range Q3 – Q1 4.35 − 2.2 = 2.15 Q1 = 2.2 Individual #25 has a value of 7.9 years, which is 3.55 years above the third quartile. This is more than 3.225 years, 1.5 * IQR. Thus, individual #25 is a suspected outlier.
Measure of Spread: Standard Deviation • The most common numerical description of a distribution is given by the mean to measure center and the standard deviation (s) to measure spread • Looks at how far observations are from their mean • The variance of a set of observations (s2) is the average of the squares of the deviations of the observations from their mean
The standard deviation (s) is then given by the square root of the variance: • The deviations xi – x are large in magnitude if observations lie far from the mean • Some deviations will be positive and some will be negative depending on if the observations are smaller or larger than the mean • The sum of the deviations of the observations from the mean will always be zero • s and s2 will be large for widely spread distributions and small if observations do not lie far from the mean
Why divide by n-1? • Since the sum of the deviations are zero, the last observation/deviation can be calculated once the other n-1 are known • Thus we say there are only n-1 degrees of freedom • Why emphasize s over s2? • s has the same unit of measurement as the original observations • Natural measure of spread for Normal distribution (section 1.3 in Modeling the World)
Example: 2, 8, 1, 3, 9, 10, 4, 5, 7, 6 • Find the mean and standard deviation. • Find the 5 number summary. • Do this by hand. • Do this by calculator.
Calculator Instructions • Stat---Edit • Enter data into List 1 (L1) • To find mean, standard deviation, and the 5 number summary: • Stat---Calc---1 var stats • X bar= mean • Sx=standard deviation • Min, Q1, Med, Q3, Max
Properties of the Standard Deviation • s measures spread about the mean • Only use when mean is measure of center • s = 0 only when there is NO spread • Occurs when all observations have same value • Otherwise, s > 0 • Like the mean, s is not resistant • A few outliers can make s very large • Remember, the deviation is squared!
Comparing Distributions • When comparing two distributions, create sentences using comparison words. • Example: The third period class has a mean score of 85.5 which is greater than the 78.3 mean score of the second period class.
More Calculator Instructions • Plotting Graphs • Have data entered into List • 2nd y= to go into stat plot • Choose your graph • Zoom stat #9