Download
1 / 85
850 likes | 974 Vues
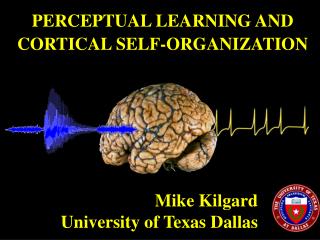
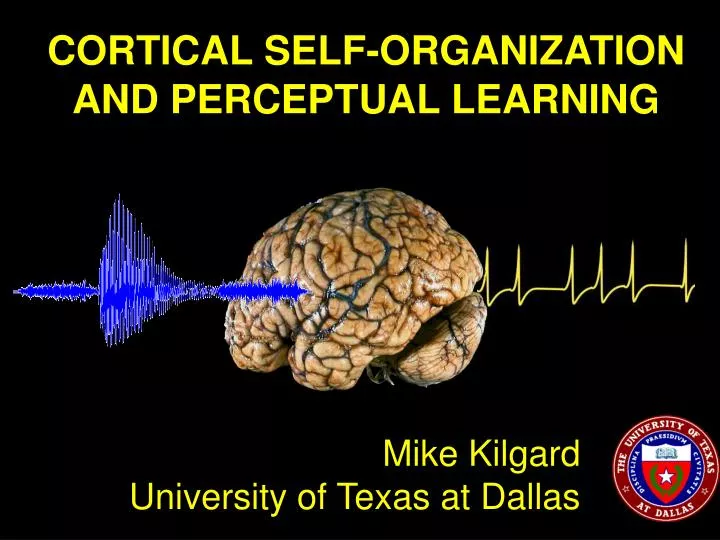
CORTICAL SELF-ORGANIZATION AND PERCEPTUAL LEARNING . Mike Kilgard University of Texas at Dallas. Action Potentials. Cochlea. Tone Frequency. Cortex.

E N D
CORTICAL SELF-ORGANIZATIONAND PERCEPTUAL LEARNING Mike KilgardUniversity of Texas at Dallas
Action Potentials Cochlea Tone Frequency Cortex • Pioneering experiments by Hubel and Wiesel, Merzenich, Weinberger, Greenough, and many others have shown that cortical circuits are highly adaptive. • Neural plasticity is likely involved in perceptual learning, development, and recovery from brain injury.
Frequency Time 15 Word Speech Stream >1045possibilities
Techniques used to study how complex sounds alter cortical processing Environmental Nucleus Basalis Behavioral Enrichment Stimulation Training
RedGroup Enriched Blue Enriched 20±10 vs. 75±20μV81±19 vs. 37±20 μV 22 rats total Journal of Neurophysiology, 2004
High-density Microelectrode Mapping
Enrichment effects persist under general anesthesia • 40% increase in response strength • 1.4 vs. 1.0 spikes per noise burst (p< 0.00001) • 10% decrease in frequency bandwidth • 2.0 vs. 2.2 octaves at 40dB above threshold (p< 0.05) • 3 dB decrease in threshold • 17.2 vs. 20 dB (p< 0.001) • Decrease in best rate by 1.1 Hz in enriched rats • 7.8 vs. 6.7 Hz (p< 0.001) n = 16 rats, 820 A1 sites Journal of Neurophysiology, 2004
200 ms Interstimulus Interval Enrichment Increases Paired Pulse Depression
Enrichment increases response strength and paired pulse depression in awake and anesthetized rats
Nucleus basalis stimulation causes stimulus specific plasticity. • NB stimulation paired with a sound 300 times per day for 25 days. • Pairing occurred in awake unrestrained adult rats. • Stimulation efficacy monitored with EEG. • Stimulation evoked no behavioral response.
Nucleus basalis stimulation paired with sensory experience can alter: • Cortical Topography • Maximum Following Rate • Receptive Field Size • Response Strength • Synchronization • Spectrotemporal Selectivity
Best Frequency NB Science, 1998
Tone Frequency - kHz Frequency-Specific Map Plasticity N = 20 rats; 1,060 A1 sites
Tone Frequency (kHz) * 40 ** * = p< 0.05 ** = p< 0.01 * ** 30 Percent of Cortex Responding to 21 kHz at 40 dB 20 10 0 Naïve Control 1 Day Post 10 Day Post 20 Day Post All Groups *
Plasticity in Posterior Auditory Field • Reduced response to low frequency tones, p<0.001 • Decreased bandwidth of high frequency neurons • 2.8 vs. 3.8 octaves, p<0.0001 (30 dB above threshold) N = 12 rats; 396 PAF sites
Response of Neurons at a Single Site to Repeated Tones • Group Average
N = 15 rats, 720 sites Nature Neuroscience, 1998
Temporal Plasticity is Influenced by Carrier Frequency N = 13 rats, 687 sites Journal of Neurophysiology, 2001
Frequency Bandwidth Plasticity N = 52 rats; 2,616 sites Stimulus Paired with NB Activation Determines Degree and Direction of Receptive Field Plasticity
15% 50 % 100% Tone Probability 0 5 10 15 Modulation Rate (pps) Frequency Bandwidth is Shaped by Spatial and Temporal Stimulus Features Temporal Modulation Leads to Larger RF’s Spatial Variability Leads to Smaller RF’s Journal of Neurophysiology, 2001
How do cortical networks learn to represent more complex sounds? • FM sweeps 32 16 8 4 2 1 Frequency 160ms Experimental Brain Research, 2004
FM Sweep paired with NB stimulation(8 to 4 kHz in 160 ms) • No map expansion • No preference for downward vs. upward FM sweeps • Decreased threshold by 3 dB and latency by 2 ms,and increased RF size by 0.2 octaves only in the region of the frequency map activated by sweep (p<0.01) 32 16 8 4 2 1 Frequency NB Stim. Time
FM Sweeps paired with NB stimulationFive downward sweeps of one octave in 160 ms • No significant plasticity 32 16 8 4 2 1 Frequency NB Stim. Time
Does acoustic context influence plasticity?Five downward sweeps of one octave in 160 ms plusunpaired upward (160 ms) and downward (40 or 640 ms) sweeps • Decreased threshold by 5 dB and latency by 2 ms,and increased RF size by 0.2 octaves all across map (p<0.01) • No preference for downward vs. upward FM sweeps 32 16 8 4 2 1 Frequency NB Stim. Time
Spectrotemporal Sequence High Tone (12 kHz) Low Tone (5 kHz) Noise Burst 100ms 20ms Frequency Time
Paired w/ NB stimulation High Tone (12 kHz) Low Tone (5 kHz) Noise Burst 100ms 20ms } Unpaired background sounds
Context-Dependent Facilitation High Tone (12 kHz) Low Tone (5 kHz) Noise Burst 100ms 20ms 0 100 200 300 400ms +50% Number of Spikes
Context-Dependent Facilitation • 58% of sites respond with more spikes to the noise when preceded by the high and low tones, compared to 35% in naïve animals. (p< 0.01) Noise Burst High Tone (12 kHz) Low Tone (5 kHz) Noise Burst N = 13 rats, 261 sites Proceedings of the National Academy of Sciences, 2002 100ms 20ms
High Tone (12 kHz) Low Tone (5 kHz) Noise Burst 100ms 20ms Context-Dependent Facilitation • 25% of sites respond with more spikes to the low tone when preceded by the high tone, compared to 5% of sites in naïve animals. (p< 0.005) Low Tone (5 kHz) N = 13 rats, 261 sites Proceedings of the National Academy of Sciences, 2002
Context-Dependent Facilitation • 10% of sites respond with more spikes to the high tone when preceded by the low tone, compared to 13% of sites in naïve animals. High Tone (12 kHz) High Tone (12 kHz) Low Tone (5 kHz) Noise Burst N = 13 rats, 261 sites Proceedings of the National Academy of Sciences, 2002 100ms 20ms
How do cortical networks learn to represent speech sounds? Frequency Time
kHz ‘SASH’ Group - Spectrotemporal discharge patterns of A1 neurons to ‘sash’ vocalization (n= 5 rats)
Tone Frequency (kHz) 16kHz @50dB: 35 % 1.9 55 % 5.3 (p<0.0005)
Sensory experience can alter: • Cortical Topography • Maximum Following Rate • Receptive Field Size • Response Strength • Synchronization • Spectrotemporal Selectivity
How does discrimination of complex sounds alter auditory cortex? • Two months of training on one of six Go-No go tasks • Anesthetized high density microelectrode mapping
High Tone (12 kHz) Low Tone (5 kHz) Noise Burst 100ms 20ms Task Schematic CS+ CS-’s CS-’s CS-’s CS-’s
Group # Frequency Discrimination HLN vs. HHH, LLL, NNN HLN vs. H, L, N HLN vs. NNN, LLL, HHH HLN vs. Reverse HLN Detection
Possible results: • Greater response to CS+ • Map expansion • HLN order preference • Temporal plasticity • Receptive field plasticity
Possible results: • Greater response to CS+ • Map expansion • HLN order preference • Temporal plasticity • Receptive field plasticity
Bandwidth at 40dB above threshold (octaves) Suppression Index Peak Latency (msec) Onset Latency to second noise Naïve Control Exposure Control Detection Frequency Triplet (high first) Sequence Element Triplet (noise first) Reverse order Naïve Control Exposure Control Detection Frequency Triplet (high first) Sequence Element Triplet (noise first) Reverse order
Exposure Control Detection Frequency Triplet (high first) Sequence Element Triplet (noise first) Reverse order F (2, 32) =14.2, MSE = 0.01, p < 0.0001
Nucleus Basalis Stimulation versus Natural Learning