Download
1 / 24
240 likes | 306 Vues
A Two-sample Approach for State Estimates of a Chronic Condition Outcome. Peter F. Graven 2010 National Conference on Health Statistics August 17, 2010 Washington, DC. Acknowledgements .

E N D
A Two-sample Approach for State Estimates of a Chronic Condition Outcome Peter F. Graven 2010 National Conference on Health Statistics August 17, 2010 Washington, DC
Acknowledgements • Research funded by a grant from the Robert Wood Johnson Foundation (RWJF) to the State Health Access Data Assistance Center (SHADAC) at the University of Minnesota, School of Public Health • Travel funded by the National Center for Health Statistics
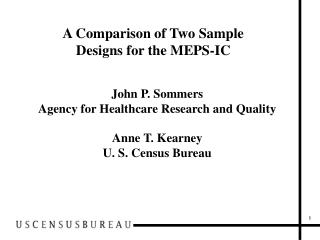
Objective • To produce state estimates of health information in the NHIS (chronic condition, pre-existing condition, etc.) • NHIS does not include state in its public use file • restricted access file provides some opportunity but sample design not intended for state-level estimates • To calculate appropriate errors for the estimates for comparison between states or as inputs in other analyses • Predict/impute an outcome measure (condition status) in a survey with state-level sample design (CPS, ACS) using NHIS data
Method • Applying elements of method used in (Schenker, N., Raghunathan, T., Bondarenko, I., 2010) * • imputed clinical values of hypertension, diabetes and obesity in NHIS with self-reported values and both clinical and self-reported values from NHANES • self-reported rates were lower than clinical values • requires multiple imputation techniques and propensity scores *Schenker, N., Raghunathan, T., Bondarenko, I., “Improving on analyses of self-reported data in a large-scale health survey by using information from an examination-based survey”. Statistics in Medicine, Volume 29, Issue 5, pages 533–545, February 2010
Method-Data • National Health Interview Survey (NHIS) 1997-2001, 2004-2008 • Minnesota Population Center and State Health Access Data Assistance Center, Integrated Health Interview Series: Version 2.0. Minneapolis: University of Minnesota. http://www.ihis.us • Harmonizes the data and documentation for the NHIS • 1,000’s of vars, 38 years, linkable to NHIS data supplements • Current Population Survey (CPS) 1999, 2006 • Miriam King, Steven Ruggles, J. Trent Alexander, Sarah Flood, Katie Genadek, Matthew B. Schroeder, Brandon Trampe, and Rebecca Vick. Integrated Public Use Microdata Series, Current Population Survey: Version 3.0. [Machine-readable database]. Minneapolis: University of Minnesota, 2010.
Method-Primary Steps 1) Assemble Data 2) Identify outcome status in NHIS 3) Create identically coded covariates in NHIS and CPS 4) Predict survey of observation using covariates, create subgroups for model 4b) Predict key variable using covariates 5) Impute missing CPS values using predicted survey, covariates (or predicted key variable) and interactions 6) Produce estimates of outcome using imputed data
Method- Data Assembly *Reference period of survey not the year it was conducted
Method-Data Assembly Same as original Impute these values
Method-Identify Outcome status • Chronic condition • Limitation of activity due to chronic condition • asked of all persons • ~12% of population nationally
Method- Create Identical Covariates *NHIS missing values imputed using sequential hotdeck
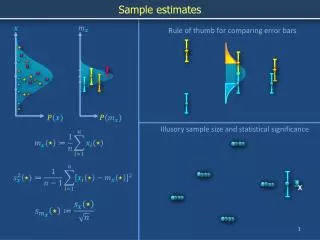
Method-Predict Survey Propensity • Survey propensity: this predicts which survey an observation is from based on its covariates. • Ideally, you would have very similar distributions implying observations are similarly likely in either dataset. • This strengthens the case for using NHIS observations to impute CPS observations
Method-Predict Survey Propensity • Why do you predict the survey? • although the values of covariates are coded the same, the responses in two surveys may not truly be identical. • Therefore, by predicting the survey there is a single dimension to assess how likely the observations are to be similar. • Why predict propensities? Isn’t that used for matching studies? • for the imputation we are looking for similar observations in different surveys to predict a likely values • Survey propensity model: age, sex, race, education, marital status, birthplace insurance status, wages, poverty, region
Method-Predict Survey Propensity 1= NHIS, 0=CPS mean>50% because there are more NHIS obs than CPS obs in the imputation sample Similar and narrow shape indicates coding is similar between surveys.
Results- Imputation Models • Full Imputation Model • All covariates interacted by propensity group • Possible due to large sample size • Parsimonious Imputation Model • predicted health status interacted by propensity group • very similar results due to strength of common health status variable • Two-Step Model • Fit all covariates on NHIS, predict on CPS • Standard errors of state means too small
Results-Selected State Means of Chronic by Model Highest 10 States Lowest 10 States
Results-Region vs. State • Using state instead of region results in 21 states with significantly different rates
Limitations/Future Research • Limitations • Model selection not optimized, primarily an exercise • Testing effects would require common variables that should also be included in imputation model • Future Research • Investigate why national means are different • Identify more commonly coded variables between surveys • Create outcomes that align with pre-existing condition definitions • Consider applications for other surveys (MEPS, BRFSS)
Summary • Newer accessible methods allows for creative integration of data sources with appropriate uncertainty incorporated • The ability to make valid state estimates is valuable for health policy • could be used to develop state estimates of those with pre-existing conditions eligible for the temporary high risk pool
Contact Info Peter Graven SHADAC 2221 University Ave SE, Suite 345 Minneapolis, MN 55414 peter@graven.com 612-624-2083
Extra: Results-Potential Upper bound of Unexplained Error at State level • From 1997-2001 NHIS released MSA names • Data assembled for 1999 CPS with matching MSA and non-MSA (region) codes. • only MSAs with over 3,000 observations per year of NHIS were used. Others grouped into their region • The MSA portion of the MSA/Non-MSA(Region) code have smaller populations than states • provides an approximate upper bound on the error in the state imputation
Extra: Results-Survey Correlation for MSA/Region • Scatterplot of CPS vs NHIS MSA/Region observations