Download
1 / 18
190 likes | 380 Vues
Solar Renewable Energy Certificate (SREC) Markets: Status and Trends. Lori Bird SREC Market Webinar hosted by NREL, January 18, 2012. Overview. Market size and scope Key market design features Eligibility, ACPs, rate caps, long term contracting provisions, etc. Market trends

E N D
Solar Renewable Energy Certificate (SREC) Markets: Status and Trends Lori Bird SREC Market Webinar hosted by NREL, January 18, 2012
Overview • Market size and scope • Key market design features • Eligibility, ACPs, rate caps, long term contracting provisions, etc. • Market trends • Trading and installations • System sizes and location • SREC Pricing • Future Outlook
SREC Markets Young; Expanded to 10 Jurisdictions NH: 0.3% solar electric by 2014 NY: 0.4788% customer-sited by 2015 IL: 1.5% PV by 2025 OH: 0.5% solar electric by 2025 OR: 20 MW solar PV by 2020 MA: 400 MW PV by 2020 NJ: 5,316 GWh solar electric by 2026 NV: 1.5% solar by 2025 PA: 0.5% PV by 2021 DE: 3.5% PV by 2026 MD: 2% solar by 2022 DC: 2.5% solar by 2023 DC NC: 0.2% solar by 2023 AZ: 4.5% DG by 2025 CO: 3% DG and 1.5% customer-sited by 2020 RPS solar carve out NM: 4% solar electric and 0.6% DG by 2020 SREC trading allowed MO: 0.3% solar electric by 2021
Each Jurisdiction has Unique Policy Targets for solar generation vary from 0.2% to 3.5% of retail electric sales.
Markets Young but Expected to Grow Rapidly • Capacity required in SREC markets (in MW) SREC markets are scheduled to grow from 500 MW in 2011 to more than 7,200 MW in 2025.
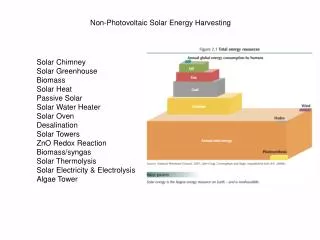
SREC Market Dominated by PV, But Solar Thermal Eligible Source: SREC Trade 2011. *Eligible solar thermal resources include solar absorption cooling, solar dehumidification, solar thermally driven refrigeration, and solar industrial process heat. • ** Solar water heating that displaces electricity is eligible for Class I of New Hampshire’s RPS (Epsen 2011). **Solar thermal is eligible for Tier 1 of Pennsylvania’s RPS.
Geographic Eligibility Rules Define Markets Several states limit eligibility to in-state development, while a few allow SRECs from a broader geographic region.
Solar ACPs Set Price Ceiling Solar ACPs are scheduled to decline over time reflecting expectations of declining PV costs.
Lack of Long-Term Contracts a Challenge • Lack of long-term contracts has been a barrier to project developers obtaining financing in some markets. • Several states have instituted long-term contracting requirements or price floors to try to overcome these challenges. • We will hear details on some of these from other presenters: • New Jersey EDC contracts • Massachusetts auction mechanism
Rate Caps Have Yet to Be Reached Rate caps exist in some form in five SREC markets, but have not been reached or are yet to be evaluated.
SREC Trading Dominated by New Jersey NJ is largest market; trading is expanding as other markets increase Based on issued volume data from PJM GATS
Solar Capacity Additions by State New Jersey leads by far, with nearly 260 MW cumulative installed capacity; Pennsylvania follows with nearly 55 MW.
In-State versus Out-of State Sourcing Source of SRECs retired for 2010 compliance Maryland: 68% in-state Ohio: 35% in-state Pennsylvania: 32% in-state DC: 13% in-state Mostly in-state Mostly out-of-state Several States Are Sourcing SRECs Primarily from In-State Systems, While Others Are Sourcing More Broadly Rules changing in Maryland and DC
Mix of PV System Sizes Installed SREC Markets Are Supporting a Mix of Solar PV System Sizes
System Size Trending Larger The number of systems greater than 250 kW has grown cumulatively from just two in 2003 to nearly 400 through the first half of 2011. Since 2008, the average size of projects in this class has been greater than 600 kW.
SREC Spot Pricing, Recently Trending Down New Jersey has Historically Experienced the Highest Prices; Recent or Forward Prices Have Dropped Significantly in Most Markets
Future Outlook • 30% drop in module prices in last year. Installed costs fell by smaller amount. • Federal Treasury 1603 cash grant program expiration creating rush. • Introduction of more utility-scale projects. • Oversupply in many state markets currently. • Policy revisions under consideration in some markets.
Full NREL report: SREC Markets: Status and Trends Co-authors: Jenny Heeter, Claire Kreycik www.nrel.gov/publications