Download
1 / 16
170 likes | 338 Vues
Advanced Dashboard. Using Excel, Excel Service and PerformancePoint. Please silence cell phones. Agenda. How do we define a dashboard, and how do I get all this stuff on my dashboard?. Microsoft BI Strategy. Excel Services Visio Services PerformancePoint. The Tool: Sharing. Excel

E N D
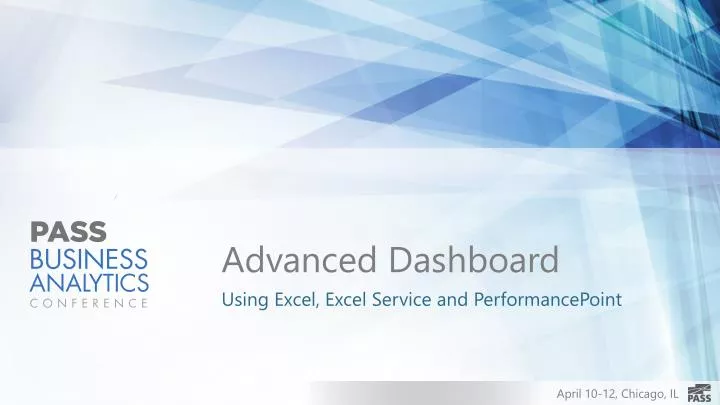
Advanced Dashboard Using Excel, Excel Service and PerformancePoint
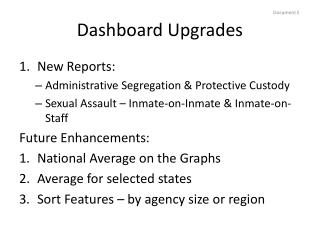
Agenda How do we define a dashboard, and how do I get all this stuff on my dashboard?
Microsoft BI Strategy Excel Services Visio Services PerformancePoint The Tool: Sharing Excel Power View PowerPivot The Tool: End user exploration Analysis Services SQL Server Integration Services The stack: Data Analysis with SQL
“Microsoft enables business users to look no further than Excel for self-service BI” The Forrester Wave™: Self-Service Business Intelligence Platforms, Q2 2012, Forrester Research, Inc., June 12, 2012.
Excel 2013 Navigate models, preview and shape up your data (Quick Explore, Quick Analysis and Flash Fill) Access and mash-up data from any source (PowerPivot) Stunning visualizations and data discovery (Power View) Work with hundreds of millions of rows of data (powered by xVelocity)
Excel Services 2013 Perform interactive data exploration Share reports with your colleagues Work together to make decisions on dashboards
What are Apps for Office? Also known as Agaves . . . Content Area Task Pane
How do Apps for Office Work? Office Application iFrames within the Office app Client JavaScript libraries for Office Manifest + JS + Office App = App for Office If you can show it in a web site, you can show it in an app. Office Web Extension JS Manifest <XML> Web Page (HTLM+JS)
PerformancePoint Services 2013 Composite Dashboard in SharePoint Share reports with your colleagues Rich Scorecard and KPI’s
Takeaways All users can transform data into insight… as a natural part of their day to day activities… with the tools they already know & love.
Resources Excel Team Blog Reporting Services Team Blog Data Visualizations in Power View What’s new in Power View in Excel 2013 and Sharepoint 2013
Win a Microsoft Surface Pro! Complete an online SESSION EVALUATION to be entered into the draw. Draw closes April 12, 11:59pm CTWinners will be announced on the PASS BA Conference website and on Twitter. Go to passbaconference.com/evalsor follow the QR code link displayed on session signage throughout the conference venue. Your feedback is important and valuable. All feedback will be used to improve and select sessions for future events.
Thank you! Platinum Sponsor Diamond Sponsor