Download
1 / 43
430 likes | 437 Vues
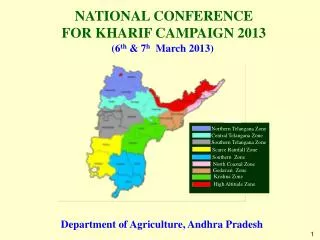
SMART Sustainable Management of Scarce Resources in the Coastal Zone Proposal N° ICA3-2001-1003 Fifth Management Board Meeting Grenoble - France, January 17-18, 2005 Lebanon Case Study – WP06. WP 00: Project coordination and administration

E N D
SMART Sustainable Management of Scarce Resources in the Coastal Zone Proposal N° ICA3-2001-1003 Fifth Management Board MeetingGrenoble - France, January 17-18, 2005 Lebanon Case Study – WP06
WP 00: Project coordination and administration Maintained on-going communication with project partners & coordinator, as conditions required, in view of information demand, monitoring of its quality & exchange for project implementation, as well as secured all necessary organizational arrangements including compilation case study reporting, beginning application of modeling, & supplying cost statements + progress reports.
WP 01: Requirements & Constraints Analysis • Completed • Lists: issues, problems, policy-relevant information • Documenting data requirements of required methods • Help in data analysis • Help in explaining constraints & alternatives
WP 02: Socio-economic framework and guidelines • Completed • Supplied data on population, demo … • Supplied data to help analyze policies and economic options for water use • Supplied data to help analyze water demand, the urban-rural interface plus sectoral projections • Supplied data to help analyze water economics vis-à-vis water resources, water pricing & sectoral coping with change
WP 03: Analytical tools, models Telemac modeling – The analysis is completed. The Scenarios were run & discussed with Sogreah. The Results presented in Grenoble Telemac meeting January 12-14, 2005.
Mediterranean Sea Tripoli Example from Telemac Model Application: Scenario BUSINESSAS USUAL, tracking pollution from River mouth affected by the wind stress from the sea
Mediterranean Sea Tripoli Example from Telemac Model Application: Scenario BUSINESSAS USUAL, Water quality
Mediterranean Sea Tripoli Example from Telemac Model Application: Scenario PESSIMISTIC, tracking pollution (different concentrations from the business as usual) from River mouth affected by the wind stress from the sea
Mediterranean Sea Tripoli Example from Telemac Model Application: Scenario PESSIMISTIC, water quality
Mediterranean Sea Tripoli Example from Telemac Model Application: Scenario OPTIMISTIC, tracking pollution (different concentrations from the business as usual) from River mouth affected by the wind stress from the sea
Mediterranean Sea Tripoli Example from Telemac Model Application: Scenario OPTIMISTIC, water quality indicator
WP 03: Analytical tools, models Waterware modeling – We attended the Izmir Training Session December 8-10, 2004. Work has progressed considerably: RRM – run complete WRM – Trial runs are going on LUC – Trial runs are going on
WRM Start nodes (springs) Control nodes Diversions Confluences Demand nodes Reservoir End node Spatial distribution of nodes
WRM Mediterranean Sea Spring Subcatchment 3 Spring Spring Spring Subcatchment 2 Sow cover area Spring What is a Start node ?? Spring Subcatchment 1 In Abou-Ali River basin, there are: Subcatchments, springs, snow melt…?? We rely on visible source Springs
WRM Abou-Ali River basin It is a dendritic scheme with; 30 nodes & 29 reaches Start nodes (springs)= 7 Control nodes = 4 Diversions = 7 Confluences = 5 Demand nodes = 5 Reservoir = 1 End node = 1 Typological presentation
Some on-going work from the LUC Modeling Rules Tripoli 88 IF FRACTION (Cont urban, 1) > 500 THEN ( *, Cont urban) REAL_INCRE 500 IF FRACTION (Cont urban, 1) < 1 THEN ( *, Cont urban) REAL-DEC 999 IF FRACTION (Discont urban, 1) > 950 THEN ( Discont urban, urban) REAL-INCRE 999 IF FRACTION (Discont urban, 1) < 1 THEN ( *, Discont urban) REAL-DEC 999 IF FRACTION (Con-Forest, 1) > 1 THEN ( *,Con- Forest) ABSOLUTE 0 IF FRACTION (Con-Forest, 1) < 500 THEN ( Con-Forest, Trans-wood)REAL-DEC 999 IF FRACTION (Broad-L-F, 1) > 1 THEN ( *, Broad-L-F) ABSOLUTE 0 IF FRACTION (Irrig land, 1) > 1 THEN ( *, Irrig land) ABSOLUTE 0 IF FRACTION (Irrig land, 1) < 500 THEN ( Irrig land, Non irrig) REAL DEC 999 IF FRACTION (Broad-L-F, 1) < 990 THEN (Broad-L-F, Agro-for) REAL DEC 999
Some on-going work from the LUC Modeling Rules Tripoli 94 IF FRACTION (Cont urban, 2) > 950 THEN ( *, Cont urban) ABSOLUTE 0 IF FRACTION (Cont urban, 2) < 1 THEN ( *, Cont urban) REAL_DEC 900 IF FRACTION (Discont urban, 2) > 500 THEN ( Discont urban, urban) ABS_INC 900 IF FRACTION (Discont urban, 2) < 1 THEN ( *, Discont urban) REAL-DEC 900 IF FRACTION (Con-Forest, 1) > 1 THEN ( *,Con- Forest) ABSOLUTE 0 IF FRACTION (Con-Forest, 1) < 500 THEN ( Con-Forest, Trans-wood)REAL-DEC 900 IF FRACTION (Broad-L-F, 1) > 1 THEN ( *, Broad-L-F) ABSOLUTE 0 IF FRACTION (Irrig land, 1) > 1 THEN ( *, Irrig land) ABSOLUTE 0 IF FRACTION (Irrig land, 1) < 500 THEN ( Irrig land, Non irrig) REAL_DEC 900 IF FRACTION (Broad-L-F, 1) < 900 THEN (Broad-L-F, Trans-Wood)ABS_ DEC 900 IF FRACTION (Trans-Wood, 1) > 500 THEN (*, Trans-Wood) ABSOLUTE 0 IF FRACTION (Trans-Wood, 1) < 500 THEN (Trans-Wood, Scierph-veg)ABS_ DEC 900 IF FRACTION (Trans-Wood, 1) < 500 THEN (Trans-Wood, Burnt area)REAL_ DEC 900
LUC Modeling Scenarios/Driving Forces CF Boundaries Each district (CF) has attribute data extracted from the socio-economic/ environmental databases that could be used for applying into the scenarios One municipality may have more than one CF
Possible Changes In Urban Expansion Another indicator of possible urban change Table: Identification of a number of urban indicators that would be used in applying the requirements of the LUC Rules with different scenarios. Spatial indicators can be static or dynamic
WP 05/07/08/09 Case Studies WP06 Lebanon Case Study
WP 06: Lebanon Case Study Tripoli, the second largest city in Lebanon along the eastern Mediterranean with a population of around 400000, is the end journey of the Abou Ali river which drains about 482 km2 of watershed (Fig. 1). The city lies in a small plain at the foot of a plateau with three tributaries of Abou Ali. The plateau, and the three tributaries, grade quickly up the steep slopes into Mount Lebanon chain to heights exceeding 1500 m where their major springs occur. Thus, within a short distance one is going from humid warm to dry and temperate. This nature, with sudden changes in topography as well as climate, induces socio-economic stresses on the community, which is scattered in lots of rural settlements, related to land exploitation and resource management.
Water balance Input – output Storage changes = 0 678 341 306 *Precipitation (including snow) *Evapotranspiration *Surface water 25 260 rivers *Losses 45 25 Springs To the sea To the neighboring countries Lakes and reservoirs 1 39 64 *Human quota *Groundwater (including soil ) 28 Domestic & industrial 11 Agricultural 678-(341+25+306+39)= -33 Groundwater storage 64-33= 31
WP 06: Lebanon Case Study Growing & Changing Demands There are acute shortages with a per capita demand of 220 m3. The annual water demand is 88 Mm3 which is supplied from surface and subsurface sources, with a very small amount, about 15 Mm3, is treated for re-use. The highest consumer is the agricultural sector at 65% - 70%, followed by 25%, 6%, 3%, and 1% for the domestic, industrial, touristic and environmental sectors, respectively. Although the growth of Tripoli urban families at about 2% is lower than the inland rural, about 3%, its population increased about 33% with density of 14000/km2 since the 1980’s, while its urban built-up land increased about 200% since the 1960’s. Obviously, this meant a huge increasing demand and stress on water, as well as devouring its once fertile and productive land. Already the preceding identifies linkages between the socio-economic activity and water uses.
WP 06: Lebanon Case Study Growing & Changing Demands Problems abound hindering the sufficient supply of water to meet growing and changing demands of the community. Several basic changes overtook the area, and are taking place that affect the linkages between socio-economics and water uses. We covered both the demographic and land use above, which leaves technological and institutional change. Privatization Upgrading water networks Waste water treatment Water prices Increasing irrigation Conservation Social fabric Institutional capacities Code of Environment Better/efficient water use
WP 06: Lebanon Case Study • Growing & Changing Demands • Projects: • Privatization • Waste water treatment • Solid waste management • Tourism management pricing allocation quality control
WP 06: Lebanon Case Study Land use/cover change The capacity for humans to change their environment and thus affect their own quality of living is of high potential. Since Land cover is related to land use, which are consumed by the community, increasing the density of population will result in a decrease in the quality and quantity of natural resources. The link of water to land cover/use comes at the top of those resources. SMART focuses on this link in a way to optimize it.
WP 06: Lebanon Case Study Land use/cover change Based on CORINE classification “level three”, an average of twenty eight classes were differentiated (Table 2.3.1). For easier interpretation we sum up the results in five main categories: (1) Human practices, (2) Agricultural lands, (3) Natural vegetation, (4) Bare lands, (5) Water bodies (Table 2.3.2).
WP 06: Lebanon Case Study Land use/cover change
WP 06: Lebanon Case Study WP10: Comparative Policy Analysis Scenarios & Driving Forces As revealed in the SMART documentation, the European framework on “DPSIR” (Driving force – Pressure – Status – Impact – Response) is used depending on indicators that reflect the forces that drive the pressures on the water system. To conform to the project requirements, the case studies had to formulate this approach classifying the driving forces indicators into 3 broad categories: population, economic development and the climate-hydrological cycle. The pressure indicators, on the otherhand, are classified into 4 main categories, all related to water: supply, demand, abstraction and pollution. These had to help define scenarios reflecting good or bad situations through identifying variables that lead to the scenarios. They have to start with the actual situation which is revealed through both “Baseline” data or status and “Business As Usual” (BAU). Then “Optimistic” and a “Pessimistic” scenarios are given in view of expert analysis of the case study.
WP 06: Lebanon Case Study WP10: Comparative Policy Analysis - Scenarios & Driving Forces
WP 06: Lebanon Case Study WP10: Comparative Policy Analysis - Scenarios & Driving Forces
WP 06: Lebanon Case Study WP10: Comparative Policy Analysis - Scenarios & Driving Forces
WP 06: Lebanon Case Study WP10: Comparative Policy Analysis - Scenarios & Driving Forces
WP 06: Lebanon Case Study WP10: Comparative Policy Analysis - Scenarios & Driving Forces
WP 06: Lebanon Case Study WP10: Comparative Policy Analysis – Scenarios & Driving Forces The preceding Scenarios (SELECTED MAJOR ONES – As Agreed) were used to test run the Telemac & Waterware Models – as shown before.
WP 06: Lebanon Case Study WP11: Dissemination & Exploitation – Stakeholders upgrading