Download
1 / 18
180 likes | 644 Vues
HEART PHYSIOLOGY & CONDUCTION SYSTEM. Ana Ribić Mentor: A. Žmegač Horvat. PHYSIOLOGY. phase 1 - A-V Valves Open, Semilunar Valves Closed. p wave of ECG atrial depolarization → atrial contraction → pressure increases → pressure gradient across the AV valves

E N D
HEART PHYSIOLOGY & CONDUCTION SYSTEM Ana Ribić Mentor: A. Žmegač Horvat
phase 1 - A-V Valves Open, Semilunar Valves Closed • p wave of ECG • atrial depolarization → atrial contraction → pressure increases → pressure gradient across the AV valves • blood flow across the open atrioventricular (AV) valves • "a-wave" • ventricular end-diastolic volume(EDV) • ventricular preload
phase 2 - All Valves Closed • QRS complex → ventricular depolarization • first heart sound (S1) • ventricular pressure rises - "isovolumetric" contraction
phase 3 - Aortic and Pulmonic Valves Open; AV Valves Remain Closed • initial and rapid ejection of blood into the aorta and pulmonary arteries from the left and right ventricles • total energy of blood • ventricular maximal outflow pressure • blood continues to flow into atria
phase 4 - Aortic and Pulmonic Valves Open; AV Valves Remain Closed • after the QRS • ventricular repolarization • T-wave • ventricular pressure falls slightly • left atrial and right atrial pressures gradually rise
phase 5 - All Valves Closed • aortic and pulmonic valves abruptly close • second heart sound (S2) • isovolumetric relaxation • dicrotic wave • end-systolic volume • LAP continues to rise http://www.google.hr/imgres?imgurl=http://www.stethographics.com/heart/images/s123.jpg&imgrefurl=http://www.stethographics.com/main/physiology_hs_introduction.html&h=312&w=545&sz=55&tbnid=_Rg21HUd1Y5qXM:&tbnh=76&tbnw=133&prev=/images%3Fq%3Dheart%2Bsound&hl=hr&usg=__K4rsx1G_XCRY8TFdItVW4Fi9rBw=&ei=dYSeS8m_A4ee_gb0_qn7CQ&sa=X&oi=image_result&resnum=5&ct=image&ved=0CBkQ9QEwBA
phase 6 - A-V Valves Open • intraventricular pressures fall below their respective atrial pressures • ventricular filling • third heart sound (S3)
phase 7 - A-V Valves Open • ventricles continue to fill with blood and expand →intraventricular pressures rise • aortic pressure and pulmonary arterial pressures continue to fall
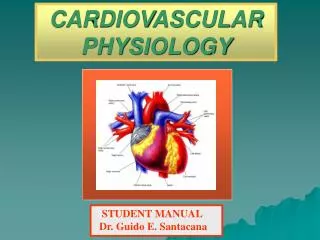
CONDUCTION SYSTEM 1. Sinoatrial node (SA node) -sends the electrical impulse that triggers each heartbeat - upper area of the right atrium 2. Atrioventricular node (AV node)- sends an impulse through the nerve network to the ventricles 3. Common AV bundle 4. Right & left bundle branches - nerve fibers that send impulses that cause the cardiac muscle tissue to contract
ELECTROCARDIOGRAM • e-lek-tro-KAR-de-o-gram - EKG/ECG • painless test that records the heart's electrical activity • signal causes the heart to contract and pump blood and creates an electrical current that can be seen on a graph called an electrocardiogram • signal causes the heartbeat • each heartbeat has two basic parts: diastole and atrial and ventricular systole
P wave - represents the wave of depolarization that spreads from the SA node throughout the atria • P-R interval-represents the time between the onset of atrial depolarization and the onset of ventricular depolarization • QRS complex - ventricular depolarization • ST segment - time at which the ventricle is depolarized andcorresponds to the plateau phase of the ventricular action potential • T wave - represents ventricular repolarizationand is longer in duration than depolarization • Q-T interval - represents the time of both ventricular depolarization and repolarization
An EKG shows: • how fast your heart is beating • whether the rhythm of your heartbeat is steady or irregular • the strength and timing of electrical signals as they pass through each part of your heart • This test is used to detect and evaluate many heart problems, such as heart attack, arrhythmia and heart failure
http://video.google.com/videoplay?docid=5701496219687599581&ei=NG-eS_T5C4rk2gLfoeH0DA&q=heart+conduction+system&hl=hr#http://video.google.com/videoplay?docid=5701496219687599581&ei=NG-eS_T5C4rk2gLfoeH0DA&q=heart+conduction+system&hl=hr#
http://www.cvphysiology.com • http://www.nhlbi.nih.gov • http://www.wisegeek.com • metacafe.com