Download
1 / 14
180 likes | 475 Vues
Blood Volume Analysis in Clinical Practice. Chris Hirt Daxor Corporation Account Manager chirt@daxor.com 410-499-7840. Ways to assess volume status. Clinical indicators (indirect):. Vital signs: BP, HR Input/Output, weights Jugular venous distension Lung sounds

E N D
Blood Volume Analysisin Clinical Practice Chris Hirt Daxor Corporation Account Manager chirt@daxor.com 410-499-7840
Ways to assess volume status Clinical indicators (indirect): • Vital signs: BP, HR • Input/Output, weights • Jugular venous distension • Lung sounds • Central Venous pressure • Edema present/absent • Hematocrit/Hemoglobin • Pulmonary Artery Catheterization • Direct Measurement: • Analysis with Daxor BVA-100
How does BVA work? • Indicator Dilution Technique • 131I labeled albumin (15 microcuries) • 1.0 ml dosimetric syringe • Very small radiation dose 2. Wait for equilibrium 1. Inject known amount /volume of tracer 3. Measure tracer concentration, calculate volume
Report Example - Hypovolemia BLOOD VOLUME ANALYSIS - FINAL REPORT Patient Name: Identification Number: 096784758 Height: 61.5 Inches Weight: 126.5 Pounds (Dev. from Ideal: 9.3%) Comments: V32406-86 Gender: Female Analyzed on: 07/14/2003 at 17:42:54 by: Dr.L & JR Sample Time Hct-A Hct-B Avg Count-A Count-B AvgCnt UnadjVol ------------------------------------------------------------------------------- Control 37.5 37.7 37.6 78 72 75 Standard-1 12081 12603 12342 Pat-Samp-1 12.0 36.6 36.6 36.6 5953 6220 6086 3043 Pat-Samp-2 18.0 36.5 36.7 36.6 6137 5920 6029 3073 Pat-Samp-3 24.0 36.6 36.1 36.3 6018 5880 5949 3104 Pat-Samp-4 30.0 36.5 36.4 36.5 5863 5729 5796 3191 Pat-Samp-5 36.0 36.2 36.5 36.4 5701 5563 5632 3281 ------------------------------------------------------------------------------- Room Background: 80 counts. Sample Acquisition Time was 3.00 min. Anti-Coagulation Factor: 1.00 Isotope: I-131 Dose: 9.5 microCi +++++++++++++++++++++++++++++++++++++++++++++++++++++++++++++++++++++++++++++++ Blood Vol.: 2910 ml Ideal Vol.: 3721 ml Deficit: 811 ml Devtn.: -21.8 % Red Cell Vol.: 956 ml Ideal Vol.: 1341 ml Deficit: 385 ml Devtn.: -28.7 % Plasma Vol.: 1953 ml Ideal Vol.: 2380 ml Deficit: 426 ml Devtn.: -17.9 % Patient Blood Volume is: HYPOVOLEMIC Normalized HCT is: 28.5% Slope is: 0.00314 Standard Deviation is: 33.7 ml ( 1.159% ) ------------------------------------------------------------------------------- Normal Mild Moderate Severe Extreme BV, PV Deviation (+/- %): 0 to 8 >8 to 16 >16 to 24 >24 to 32 >32 RCV Deviation (%) 0 to 10 >10 to 20 >20 to 30 >30 to 40 >40 Bench Work performed by Nuclear Medicine Patient Results BVA Normal and Abnormal Ranges
Report Example - Hypovolemia BLOOD VOLUME ANALYSIS - FINAL REPORT Patient Name: Identification Number: 096784758 Height: 61.5 Inches Weight: 126.5 Pounds (Dev. from Ideal: 9.3%) Comments: V32406-86 Gender: Female Analyzed on: 07/14/2003 at 17:42:54 by: Dr.L & JR Sample Time Hct-A Hct-B Avg Count-A Count-B AvgCnt UnadjVol ------------------------------------------------------------------------------- Control 37.5 37.7 37.6 78 72 75 Standard-1 12081 12603 12342 Pat-Samp-1 12.0 36.6 36.6 36.6 5953 6220 6086 3043 Pat-Samp-2 18.0 36.5 36.7 36.6 6137 5920 6029 3073 Pat-Samp-3 24.0 36.6 36.1 36.3 6018 5880 5949 3104 Pat-Samp-4 30.0 36.5 36.4 36.5 5863 5729 5796 3191 Pat-Samp-5 36.0 36.2 36.5 36.4 5701 5563 5632 3281 ------------------------------------------------------------------------------- Room Background: 80 counts. Sample Acquisition Time was 3.00 min. Anti-Coagulation Factor: 1.00 Isotope: I-131 Dose: 9.5 microCi ++++++++++++++++++++++++++++++++++++++++++++++++++++++++++++++++++++++++++++++ Blood Vol.: 2910 ml Ideal Vol.: 3721 ml Deficit: 811 ml Devtn.: -21.8 % Red Cell Vol.: 956 ml Ideal Vol.: 1341 ml Deficit: 385 ml Devtn.: -28.7 % Plasma Vol.: 1953 ml Ideal Vol.: 2380 ml Deficit: 426 ml Devtn.: -17.9 % Patient Blood Volume is: HYPOVOLEMIC Normalized HCT is: 28.5% Slope is: 0.00314 Standard Deviation is: 33.7 ml ( 1.159% ) ------------------------------------------------------------------------------- Normal Mild Moderate Severe Extreme BV, PV Deviation (+/- %): 0 to 8 >8 to 16 >16 to 24 >24 to 32 >32 RCV Deviation (%) 0 to 10 >10 to 20 >20 to 30 >30 to 40 >40 Bench Work performed by Nuclear Medicine Patient Results BVA Normal and Abnormal Ranges
Normalized Peripheral Hematocrit NPHct = Normalized Peripheral Hematocrit • Is the change in the hematocrit that would occur by adjusting the plasma volume so that the patient’s whole blood volume is at the ideal blood volume. NPHct = mBV x MPHCT iBV EXAMPLE #1 • Patient with ideal blood volume of 5,000 ml, measured blood volume 4,000ml, hematocrit of 40% 4,000 x 40 = 32% (normalized hematocrit) 5,000
Common Surrogate MarkersHematocrit & Hemoglobin Hypervolemic Normal red cell 6500cc Normovolemic Normovolemic Hypovolemic Normal red cell Anemia Anemia 5000cc5000cc 3750cc Plasma Volume Red Blood Cell Volume Hematocrit 45% 30% 30% 30% Surrogate Markers Do Not Provide A Blood Volume Measurement
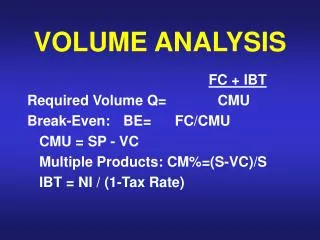
Tracer Concentration x x Mix x x BV Measured BV (ln) x 12 36 Time (min)>> The Process – Why Five Data Points? • Mixing Time • Transudation • Accuracy
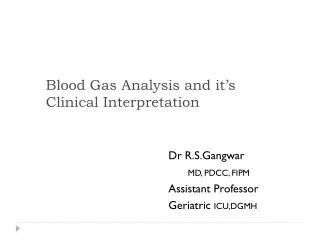
BVA in Septic Shock / Trauma “Slope” reflects albumin transudation from vascular compartment In normal subjects, the rate of movement of albumin across the capillary bed into the lymphatic system is approximately 0.0025% per minute. Increased slope suggests increased capillary permeability, a possible measure of systemic inflammatory response, particularly in septic shock. Important Point! An important point to remember is that a normal rate of transudation does not necessarily rule out capillary damage. The reason for this is that in situations where the intravascular albumin level drops and the extra vascular level increases, the decrease in albumin gradient may result in a stabilization in the rate of transudation. This condition can be suspected in situations where patients have low serum albumin levels. The ultimate proof of this hypothesis is to actually measure total body albumin. Calculated Intravascular Volume - ml Time Point Of Sampling - Minutes
1. Congestive Heart Failure 2. Syncope 3. Hypertension 4. Chronic Hypotension 5. Orthostatic Hypotension 6. POTS Syndrome 7. Polycythemia 9. Renal Dialysis 10. Pre/Post Surgical Volume Status 11. Blood Transfusion Assessment 12. Pre-Operative Hemodilution 13. Pre-Operative screening for hypovolemia 14. Shock Blood Volume Analyzer Medical Conditions
Clinical Application—Critical Care • ICU, CCU, SICU • Determine red blood cell and plasma volume status in critically ill patients to guide treatment. • Identify hypovolemia in the presence of septic shock or peripheral edema. • Differentiate dilutional from hypovolemic from normovolemic anemia. • Differentiate IADHS from hyponatremia/renal salt wasting syndrome. • Define a true intravascular volume status for patients receiving ultrafiltration or CRRT therapy.
Correlation Between Blood Volume and Pulmonary Artery Catheter MeasurementsElisabeth Biuk-Aghai MD, Hideko Yamauchi MD, Mihae Yu MD, Hao Chih Ho MD, Alyssa Chapital MD, Danny Takanishi MDDepartment of Surgery, Division of Surgical Critical Care, Queen’s Medical Center, University of Hawaii, Honolulu, HI • Purpose: to investigate the relationship between parameters obtained from a PAC and simultaneous measurments of blood volume. • Twenty ICU patients contributed 29 simultaneous blood volume and PAC values. • Euvolemia was present in 11 of 29 instances, hypervolemia in 17 of 29, with 1 value demonstrating hypovolemia. • Although there was a statistically significant relationship between PAOP and BV, BV information resulted in different treatment in 6 out of 29 (21% of the time) with 4 of the 6 times showing clinical improvement when BV information was used. • Regardless of the different ranges of the PAOP it was difficult to predict euvolemia vs. hypervolemia. All patients had skin edema from shock and resuscitation and assessment of intravascular blood volume was difficult. • Conclusion: There may be a role for BV measurment in patients after the acute resuscitation when there is a clinical dilemma regarding blood volume treatment. Due to the limitations of a retrospective study, we cannot infer outcomes until a prospective randomized study is done.
Relationships between Blood Volumeand Pulmonary Artery Occlusion Pressure Although there was a statistically significant correlation between PAOP and BV, PAOP level (≤12 mm Hg, 13-18 mm Hg, or >18 mm Hg) could not be used to predict euvolemia vs. hypervolemia. BV results led to different treatment in 6 out of 29 (21%) instances, with 4/6 times showing subsequent clinical improvement.
How to order Blood Volume Analysis? • Go to Power Chart • Enter “Whole Blood Volume” and you will be presented with an existing orderable. • *In the comment section please put BVA method.*