Download
1 / 109
1.1k likes | 1.28k Vues
Are Fish in Hot Water?. Presentation to the Climate Impacts Group University of Washington November 9, 2004. John Bartholow USGS Fort Collins Science Center. Approximate “temperature-limited” range of trout under “current” conditions (23.8°C) (Bartholow 1989).

E N D
Are Fish in Hot Water? Presentation to the Climate Impacts Group University of Washington November 9, 2004 John Bartholow USGS Fort Collins Science Center
Approximate “temperature-limited” range of trout under “current” conditions (23.8°C) (Bartholow 1989)
Approximate “temperature-limited” range of trout under altered conditions (23.8°C + 2.7°C) (Bartholow 1989)
Approximate “temperature-limited” range of trout under altered conditions (23.8°C + 5.5°C) (Bartholow 1989)
A Presentation in Four-parts • 1. Evidence for warming in the Lower Klamath River • 2. Linkages between temperature change and freshwater fish biology • 3. Simple assessment method (metric) • 4. Complex assessment method that incorporates both flow and temperature in a mechanistic model
“Yeah, well. I don’t care what the new regulations say. ‘Catch and release’ is a stupid rule.”
Part One • Review measured data and model results for evidence, if any, of basin-wide warming of the lower Klamath River below Iron Gate Dam in the post-impoundment period (WY 1962-2001) Derived from presentation given with Sharon Campbell, USGS
Methods • Use trend detection methodology (Gilbert 1987) to examine: • Historical basin-wide water temperature records • Simulated river temperatures and derived metrics • Historical air temperature and hydrology records
Gilbert (1987) Technique • Provides non-parametric estimates of monthly and annual linear trends in time series data • Works by computing median of all possible slopes between data points • Unbiased by non-normal outliers • Relatively insensitive to randomly missing data • Used previously by hydrologists (Fox et al. 1990)
Years of temperature gage record ~ 1960-85 30 16 18 13 16 15 17 14 21 22 25
Results of Historical Analysis • Estimated basin-wide water temperature trend averaged 0.4°C increase per decade • 10 stations showed positive trends, but • 2 stations had small negative trends, • 3 stations showed no trend at all, and • Only three stations were statistically significant • Overall – Inconclusive! ?
Filling the Temperature Record • Used Army Corps of EngineersHEC-5Q water temperature model (part of the SIAM-DSS) for 1962-2001 • Calibrated to historical and newly collected mean daily temperature data • R² = 0.96, p<0.001 • Mean absolute error ~1.8°C (~1°C w/o bias) • No significant trend in model residuals except at mouth of river, i.e., model was unbiased View Movie
Estimated Klamath River Trends, 1962-2001 Upstream to Downstream
Metrics from DSS (SIAM) • Cumulative degree-days > 15°C • # Weeks > 15°C • # Days > 20°C • Hot season length (# days > 15°C) • # River km < 15°C(all computed annually)
Season Length (days) > 15°C (First day to last day)
Historical Hydrology Trends • Annual trend in discharge was small (-33 cfs/decade) relative to typical flow rates (> 1000 cfs) ?
Air Temperature Trends * = NS
Trends Perhaps Related to PDO (Univ. of Washington/Mantua 2003)
But Correlation Was Not Strong (at least not on an annual basis) ?
Conclusions • Analysis of spotty and short duration historical water temperature data proved inconclusive • Simulated water temperatures (to fill in the record) revealed increases in biologically significant temperatures and derived metrics for 1962-2001
Conclusions (cont.) • Estimated trend in basin-wide water temperatures was about +0.5°C per decade • Trends seem largely unrelated to hydrology, but, • Trends do seem to be related to basin-wide air temperature • and perhaps to the Pacific Decadal Oscillation
Consequences • Trend in both magnitude and duration of temperatures directly relevant to freshwater salmonid survival has been increasing
Consequences (cont.) • Mean weekly temperature of 23-24° is a useful benchmark for presence/ absence of coho and Chinook (Eaton et al. 1995) • Mainstem Klamath River regularly exceeds mean weekly temperatures of 24°C (regardless of whether one looks at simulated or measured data)
Consequences (cont.) • Cooler weather may return to the basin, but • Until it does, discussion on the fate of the salmon will remain heated! ?
Part Two • World’s shortest primer on thermal effects governing fish • Though most of my work has been on coldwater salmonid species, the principles apply across most every aquatic obligate species With thanks to Bruce Webb
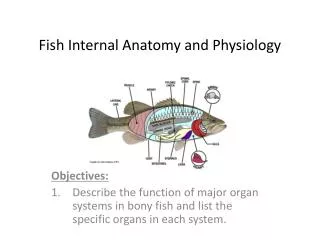
Thermal Effects • Most aquatic organisms are poikilothermic, i.e. have very limited physiological control over their body temperature • Temperature influences almost every process and relationship governing stream & river biota
Thermal Effects on Fish Increasing complexity to understand
Functional Forms • A simple view of lethal temperature suggests fish are killed when heated above, or cooled below, their tolerance range 1.0- Survival 0.0- Temperature
But Note: • Lethality is actually much more complex and influenced by many factors (Langford 1990), including: • rate of temperature change • duration of exposure • acclimation (previous thermal history) • organism size or life history stage • physiological state (starvation or other stresses)
Functional Forms (cont.) Opt ZNG ZNG 1.0- Growth (or Performance) 0.0- Temperature ZNG = Zero Net Growth
Note this curve’s skew to the right and the relatively precipitous drop from optimum to zero (or negative) growth Important Considerations Opt ZNG ZNG 1.0- Growth 0.0- Temperature
Also, lethal zone still bounds the curve such that some individuals will grow fast, but population as a whole will decline due to thermal & stress-related mortality Important Considerations (cont.) Opt ZNG-p 1.0- Growth 0.0- Temperature
High end of optimum is emerging as the “gold standard” for setting water temperature criteria for fish populations in serious need of restoration (USEPA 2003) Leading to … Criteria Setting Opt 1.0- Growth 0.0- Temperature
Part Three • A simple assessment model (metric) • Example derived from work on the Stanislaus River in California’s Central Valley With peer review colleagues Mike Deas, Chuck Hanson & Chris Myrick
The Problem (simplified) • Deep reservoir releases (followed by surface releases) largely control downstream thermal regime • Water is a scarce resource • Delivered within a legal and institutional framework • But with attention to salmon restoration goals • Search for improved system operation criteria • What thermal attributes should be measured? • How should they be used to “judge” one (simulated) alternative from another?
Previous Thermal Criteria • Dueling Criteria • Irrigation District, vs. • California Department of Fish and Game • Based on thermal tolerance per salmon and steelhead life stage (e.g., adult immigration, adult spawning, egg incubation, fry rearing, juvenile rearing, juvenile emigration, smoltification)
Previous Thermal Criteria (cont.) • Used two different metrics for each lifestage based on extensive literature: • Daily average • 7-day average of the daily maximum • And applied two different ways • Multi-tier approach (e.g., optimal, suboptimal, acute) • Degree-days
But … • Existing assessment failed to distinguish between water management alternatives for the simulation period • I.E., no clear winners regardless of the criteria applied
So We Tried … • Refining their tiered approach using optimum temperatures as now defined by USEPA (2003) • And estimating suboptimal temperature criteria as (Tw(optimal)+b) • where safety factor b = 2oC after Coutant (1972)