Download
1 / 34
340 likes | 427 Vues
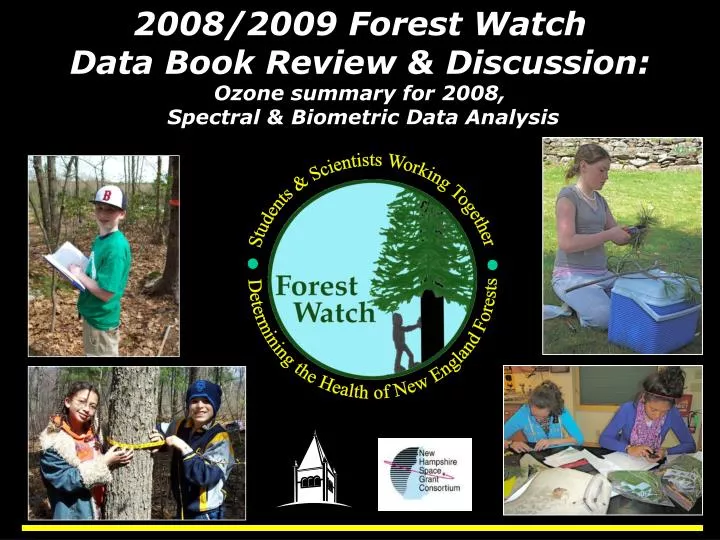
2008/2009 Forest Watch Data Book Review & Discussion: Ozone summary for 2008, Spectral & Biometric Data Analysis. Students & Scientists Working Together Determining the Health of New England Forests.

E N D
2008/2009 Forest Watch Data Book Review & Discussion: Ozone summary for 2008, Spectral & Biometric Data Analysis Students & Scientists Working Together Determining the Health of New England Forests
Forest Watch offers students and teachers authentic opportunities in science by participating in on-going research to assess the health of forests in New England. several ecological and biophysical measurements in white pine stands, looking for signs of ground-level ozone damage and other forest health concerns.
Eastern White Pine Pinus strobus • Selected Because: • It is a Bioindicator of Groundlevel • Ozone (SMOG) Exposure • Common in New England • Retains foliage year-round, can be studied throughout the school year • Often occurs outside the classroom • (a local fieldtrip)
From The Macroscope to the Microscope Magnification Tree Branch Needle Needle Cross Section 4 m 25 mm 1.5 mm 0.5 mm
Landsat ETM Image • false color composite • bands 4/3/2 • Infared Mimic • 10-11-99 Durham NH Each Pixel or PSSP = 30meters X 30 meters College Woods
Figure 6: Number of 8-hr exceedances, compared to the number of days with temperatures greater than 90ºF, as measured at Bradley Airport outside Hartford, CT. 1983-2009. Source: http://www.epa.gov/region01/airquality/graph.html
NAAQS NATIONAL AMBIENT AIR QUALITY STANDARDS 1-hour 120ppb (parts per billion): the average of the 4 highest values must be < 120ppb over any 1 hour period each day. 8-Hour (1997) 80ppb (parts per billion): the average of the 4 highest values must be 80 ppb over any 8 hour period each day. 8-Hour (2008) 75ppb (parts per billion): the average of the 4 highest values must be < 75 ppb over any 8 hour period each day.
OZONE POLICY IN TRANSITION: 1971: EPA established a 1-hour ozone standard of 80 ppb.1979: EPA revised the 1-hour standard to 120 ppb. 1997: 1-hr 120ppb revised to 8-hr 80ppb 2003: States and Tribes Submitted to the EPA their designations for non-attainment. 2004: Official non-attainment designations based on data from 2000-2002. (avg. annual 4th highest max daily 8-hr values from 55+ stations) 2005: 8-hr 80ppb NAAQS made official. 2007: State Tribal and Local Governments submit State Implementation Plans (SIP’s). detailing how they will meet attainment by deadlines determined by their non-attainment status. 89 of 126 areas nationally listed in non-attainment met standard between 2004 and 2006 (13% ozone decline 02-06!) 2008: March 12th 2008 , new 8-hr 75ppb NAAQS made official 2009: States and Tribes Submitted to the EPA their designations for non-attainment. 2010: March, official designations based on 2007-2009 monitor data, followed by revised SIP’s 2013-30: Attainment dates depending on severity of problem
US Counties currently in non-attainment to the 75ppb NAAQS, established on March 12, 2008. Source: http://www.epa.gov/air/ozonepollution/actions.html#mar07
Figure 5: US Counties that would be in violation to the 60-70ppb NAAQS, proposed by the EPA on January19, 2010. Source:(http://www.epa.gov/groundlevelozone/fr/20100119.pdf)
Figure 7: Graph of the Number of Exceedance Days by State in Region 1: • New England based on the 1997 8-hour (80ppb) NAAQS, 1983-2009. • Source :http://www.epa.gov/region1/airquality/standard.html
Figure 8: June-August, ranked precipitation and temperature from 1991-2008 for New England • plotted against 8-hr ozone exceedance events for Region 1. • Climate Data: http://www.ncdc.noaa.gov/oa/climate/research/cag3/nt.html • Ozone Data: http://www.epa.gov/region1/airquality/standard.html
Long Term Spectral & Biometric Analysis of Forest Watch Data VIRIS Visible/InfraredIntelligent Spectrometer UNH Spectral Data Student Biometric Data Monitoring the Photosynthetic Capacity of our Forests
5 7 4 1 2 3
In 2008, high REIP values corresponded to low ozone values as they have in most years since Forest Watch began. 2004 through 2007 are our highest REIP values. REIP is rising over time, Our white pines are getting healthier!
Figure 25: Spring precipitation trends 1990-2008 Source: http://www.ncdc.noaa.gov/oa/climate/research/cag3/nh.html
Figure 8: June-August, ranked precipitation and temperature from 1991-2008 for New England plotted against 8-hr ozone exceedance events for Region 1.
Figure 15: Average Red Edge Inflection Point (REIP) values for all New Hampshire schools compared to the number of 8-hour (80ppb) ground-level ozone exceedance events each year from 1991-2008.
Figure 18: Red Edge Inflection Point (REIP) values for New Hampshire, Massachusetts, Maine, Connecticut and Vermont 1991-2007.
% WATER CONTENT TM5/TM4 P = <0.0001 P = 0.0431 Figure 23B: Percent Water Content vs. Needle Age Class Figure 23A: TM54 vs. Needle Age Class
NIR3/NIR1 1 3 Figure 21: NIR 3/1 foliar development index for New Hampshire, Massachusetts, Maine, Connecticut and Vermont 1993-2007. P = <0.0001 Figure 24: NIR 3/1 vs. Needle Age Class
Figure 25: Spring precipitation trends 1990-2008 Source: http://www.ncdc.noaa.gov/oa/climate/research/cag3/nh.html
WATER CONTENT Figure 29: Percent needle water content 1992-2007. Figure 30: Percent water content: UNH Lab vs. Students Measurements Figure 31: Percent water content vs. Needle Age Class
Figure 25: Spring precipitation trends 1990-2008 Source: http://www.ncdc.noaa.gov/oa/climate/research/cag3/nh.html
Figure 29: Percent of white pine needles with presence of both symptoms, (chlorotic mottle & tip necrosis) 1996-2008.
Students & Scientists Working Together Determining the Health of New England Forests • Dr. Barrett Rock, & Michael Gagnon • Complex Systems Research Center • University of New Hampshire • Durham, NH 03824 • Phone: 603-862- 4113 • Fax: 603-862-0188 • mgagnon@garnet.sr.unh.edu • barry.rock@unh.edu