Download

1 / 37
370 likes | 493 Vues
Decision Making for Results Data Teams. Des Moines Public Schools August 1-2, 2011. Blame it on Wisconsin!. Blame it on Wisconsin!. Monitoring ratio of mosquito bites to horsefly bites Daily naps justified as an “intervention” Volunteering as a “meat and cheese only” control group

E N D
Decision Making for ResultsData Teams Des Moines Public SchoolsAugust 1-2, 2011
Blame it on Wisconsin! • Monitoring ratio of mosquito bites to horsefly bites • Daily naps justified as an “intervention” • Volunteering as a “meat and cheese only” control group • Differentiated based on “readiness” for 2 daughters who wanted to kayak • Missed SMART goal of running at least 3 miles for five days straight.
If it’s all about “achievement”…what do we mean? WTL: Quick-write, whip-around, consensus
Learning Targets • I can select relevant data to track progress toward increased achievement • I can interpret data to reveal strengths and targeted areas for growth • I can relate the impact of adult actions to the learning of students • I can actively participate to keep our learning moving forward • ???
Breaking News… • …on monitoring and responding to data "I don't see any community doing that well," said Gene Wilhoit, executive director of the Council of Chief State School Officers. "I am putting that back on the shoulders of teachers. This is a process of internal debate, conversation and thoughtful analysis and experimentation.” July 26, DSM, Iowa Education Summit
Principles ofDecision Making For Results Antecedents Accountability Collaboration
Becoming Data Driven How are you currently embracing a data-driven decision-making process that leads to results?
Results-Driven Schools • Where is the proof? • 90/90/90 Schools, Reeves 2003 • Education Trust, 2002 • NCREL, 2000 • Consortium for Policy Research in Education, 2000 • EdSource, 2005 • Northern Illinois University Center for Governmental Studies, 2004 Data Driven Decisions
Reflection “The value of the data emerges only when analysis provides insights that direct decisions for students.” White, 2005
DMR Building the Foundation • Cause data and effect data • Continuous improvement cycle • Principles and processes of Decision Making for Results: Data-Driven Decision Making
“Only by evaluating both causes and effects in a comprehensive accountability system can leaders, teachers, and policymakers understand the complexities of student achievement and the efficacy of teaching and leadership practices.” Reeves, 2006
Effect data: Outcomes or results Cause data: Professional practices that create specific effects or results Definitions and Examples
Leadership and Learning Matrix • Think of a grade-level team or a department in the building where you last worked. • Identify where on the matrix you think that team or department resides. • Write down at least three justifications for why you placed them there. • Justifications must connect cause and effect data • Find someone else in the room that placed a team in a different quadrant and share your findings. WTL: Matrix Writing Frame
Learning Targets • I can select relevant data to track progress toward increased achievement • I can interpret data to reveal strengths and targeted areas for growth • I can relate the impact of adult actions to the learning of students • I can actively participate to keep our learning moving forward • ???
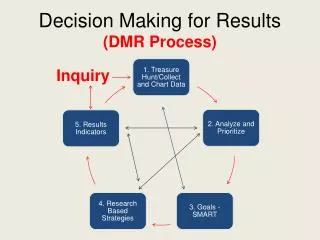
The Process for Results Treasure Hunt Analyze to Prioritize Inquiry; Develop Questions SIP SMART Goals Monitor & Evaluate Results Results Indicators Specific Strategies
Inquiry “Data-driven decision making begins by asking fundamental questions.” Doug Reeves • What do you wonder about achievement in your building? • What specific questions about teaching and learning can be derived from these greater “wonder-ments?” WTL: Inquiry Writing Frame
Step 1: Conduct a Treasure Hunt • Why? To gather and organize data in order to gain insights about teaching and learning practices • Considerations • Measures of data • Disaggregation • Triangulation • Reflection
Can You Identify with This? “It is not so much a lack of data, but an absence of analysis, and an even greater absence of actions driven by the data.” White, 2005
Step 2Analyze Data to Prioritize Needs Analysis of 8th Grade School DataRole-play
Analyze Data to Prioritize Needs • Why? To identify causes for celebration and to identify areas of concern • Considerations • Strengths • Needs • Behavior • Rationale
Quality Prioritization • Why? To take immediate action on the most urgent needs • Quality prioritization requires a thorough understanding of: • Student population • Curriculum and Power/Priority Standards (leverage, readiness) • Antecedents affecting student achievement • Quality of program implementation White, 2005
Step 3Establish SMART Goals • Why? To identify our most critical goals for student achievement based on the challenges that were identified through the inquiry process • Specific, Measurable, Achievable, Relevant, Timely
Step 4Select Specific Strategies Let’s watch a leadership team as they enter this stage of the process…
Select Specific Strategies • Why? • Adult actions will impact student achievement • Strategies are— • Action-oriented • Measurable/accountable • Specific • Research-based • Considerations: Instructional, organizational, leadership, programmatic
Research-Based Strategies • Reeves, D.B. (2003. 90/90/90 schools. Retrieved from www.leadandlearn.com • Reeves, D.B. (2006). Ten things high schools can do right now to improve student achievement. Retrieved from http://www.leadandlearn.com/resources/custom/Presentations/4.2.08.NY.NYC.pdf • Learning 24/7 Observation Study (2005).What’s happening in schools? Or not?
Additional Evidence in Support of Research-Based Strategies • Zemelman, S., Daniels, H., & Hyde, A. (2005). Best practice. Portsmith, NH: Heinemann. • Marzano, R. (2007). The art & science of teaching. Alexandria, VA: ASCD. • Barr, R., & Parrett, W.H. (2007). The kids left behind. Bloomington, IN: Solution Tree. • Marzano, R., Waters, T., & McNulty, B. (2005). School leadership that works. Alexandria, VA: ASCD.
Select Your Specific Strategies • Revisit your prioritized needs • Research the best possible strategies to meet the learner needs • Classify each type of strategy: Instructional, organizational, programmatic, and leadership
Step 5Determine Results Indicators Why? To monitor the degree of implementation and evaluate the effectiveness of the strategies
Results Indicators • Considerations • Serve as an interim measurement • Used to determine effective implementation of a strategy • Used to determine if strategy is having the desired impact • Help to determine midcourse corrections
Results Indicator Application • Revisit strategies (Step 4) • Develop results indicators (“If --- Then” statements)
“Improvement cycles require leadership follow-up and relentless efforts to maintain the focus on data if decisions are truly going to be driven by informed data.” White, 2005
Step 6Monitor and Evaluate Results Why? To engage in a continuous improvement cycle that— • Identifies midcourse corrections where needed • Adjusts strategies to assure fidelity of implementation
Develop Your Monitoring Plan • Review your work from developing questions to determining results indicators then determine how you will monitor the strategies. When you create your monitoring plan consider: • Teacher or administrator teams • Monitoring cycles • Goals • Strategies • Impact on student and adult behavior • Ability to make midcourse corrections
…After all these words, statistical analyses, and graphs,… What we do matters.” Reeves, 2006 • WTL – Lunch Exit Slip (leave at your tables) • Based on your strengths as a leader and new learning up to this point, what positive contributions are you prepared to make to the School Improvement process in your building?