Download
1 / 9
90 likes | 204 Vues
Report Page 27. Graphical display of the development of net sales (in mill. EUR). Food Division Net Sales Belgium (mill. €). Food Division Net Sales Switzerland (mill. €). 19,9. Mio €. Mio €. 19,2. 18,9. 20. 20. 16,5. 15. 15. 9,9. 10,3. 6,2. 7,1. 10. 10. 5. 5. 0. 0. 2009.

E N D
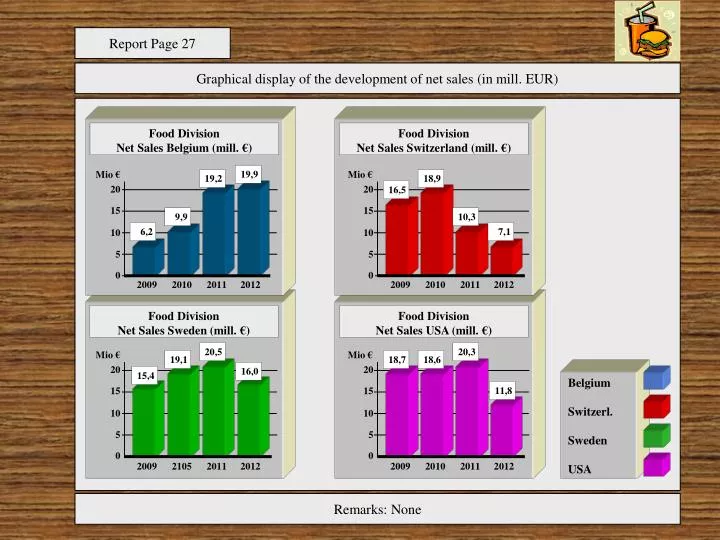
Report Page 27 Graphical display of the development of net sales (in mill. EUR) Food Division Net Sales Belgium (mill. €) Food Division Net Sales Switzerland (mill. €) 19,9 Mio € Mio € 19,2 18,9 20 20 16,5 15 15 9,9 10,3 6,2 7,1 10 10 5 5 0 0 2009 2010 2011 2012 2009 2010 2011 2012 Food DivisionNet Sales Sweden (mill. €) Food DivisionNet Sales USA (mill. €) 20,5 20,3 Mio € Mio € 19,1 18,7 18,6 20 20 16,0 15,4 Belgium Switzerl. Sweden USA 11,8 15 15 10 10 5 5 0 0 2009 2105 2011 2012 2009 2010 2011 2012 Remarks: None
Nomarcosalrededor de valores No decoración No pseudo-3D Report Page 27 "Food Division“ es untítulo Graphical display of the development of net sales (in mill. EUR) Nomarcosybordes Food Division Net Sales Belgium (mill. €) Food Division Net Sales Switzerland (mill. €) „Net Sales“ es untítulo 19,9 Mio € Mio € 19,2 18,9 20 20 16,5 Nocolores sin significado 15 15 9,9 10,3 Nolineashoricontales 6,2 7,1 10 10 5 5 0 0 2009 2010 2011 2012 2009 2010 2011 2012 "Mill. €“ es reduntante Noejes verticales (Y) Food DivisionNet Sales Sweden (mill. €) Food DivisionNet Sales USA (mill. €) 20,5 20,3 Mio € Mio € 19,1 18,7 18,6 20 20 16,0 15,4 Belgium Switzerl. Sweden USA 11,8 15 15 10 10 5 5 0 0 2009 2010 2011 2012 2009 2010 2011 2012 Nofuentecon „serifs“ Nouseleyendas Remarks: None
Food DivisionNet Sales in mill. EUR Belgium Switzerland 19,9 19,2 18,9 16,5 9,9 10,3 6,2 7,1 2009 2010 2011 2012 2009 2010 2011 2012 Sweden USA 20,5 20,3 19,1 18,7 18,6 16,0 15,4 11,8 2009 2010 2011 2012 2009 2010 2011 2012
In year 9 (Budget) we plan a budget increase of six percent +6% 1 Mensaje AFG Division Net Sales in mill. EUR Year 1 – Year 9 (Budget) 2 Título 5 Acentuación 402 388 366 330 333 327 307 309 305 3 Gráfico 1 2 3 4 5 6 7 8 Budget 4 Pie de página Source: Published Yearly Reports year 1 to year 8 (nominal) and Budget
Managers can only understand the shown information quickly (like road maps) if we use a consistent notation Conceptual Sales in Euro/Period Headcount in FTE Production in units Percentages as Rentabilities Prices, Costsin Euro/Unit ACT ACT - BUD
Business charts with high information density give a better overviewby allowing comparisons Essen Profit by Divisions in mill. EUR Offices Europe Q1 A1 A1 A1 A1 -4 13 3 12 A1 -6 -1 -1 41 B1 BX BX BX BX 12 3 B2 8 C1 C1 C1 12 C1 -5 -8 C1 40 C2 C2 C2 10 C2 -3 C2 10 12 DL DL DL 3 DL DA -8 9 3 14 DM DM DM DM -3 DB 3 18 GA GA GA 3 GA 12 22 6 S Berlin Bern Düsseldorf -23 GB GB GB GB 34 A1 A1 -5 A1 A1 52 45 -12 -6 B1 -6 23 BX BX BX -12 -12 B2 5 11 C1 C1 C1 C1 -4 12 3 C2 37 C2 C2 C2 -7 4 44 DL 29 DL DL DA 12 25 9 DM 34 DM DM DB -6 32 3 GA -3 GA GA S 12 22 Frankfurt Innsbruck München -3 -10 Nürnberg GB GB GB -23 A1 A1 A1 A1 A1 -4 6 8 -4 B1 -5 7 9 BX BX BX BX B2 -6 -9 11 10 C1 C1 C1 C1 C1 3 7 C2 5 7 C2 C2 C2 C2 -5 -5 44 10 DL DL DL DL DA -11 9 DM 12 5 DM DM DM DB -5 -6 3 3 GA GA GA GA S 22 -3 Salzburg St. Gallen -3 Wien -9 Zürich GB GB GB GB Source: T56 vom 23.4.
Nouseterminoscomounidad, valor, estructura, desarollo etc. Nosunrayado si nohaysigificado Nofuentecomo „serifs“ EUR es parte del título Presantación en mil Euros masquesuficienteparaunreporte demanagement „Total“ tieneunnombre! Lineasadicionalesayudan a ler las informaciones Notaciónunificadopararegiones, sucursales, divisiones Nocambieelconcepto de las columnas sin noticia Nosombra, trama, relleno sin sigificado Necesita dos digitosdespieus del coma?? Con alineación a la derecha de los títulos de columnaspuedaevitar los bordesverticales