Download
1 / 41
410 likes | 515 Vues
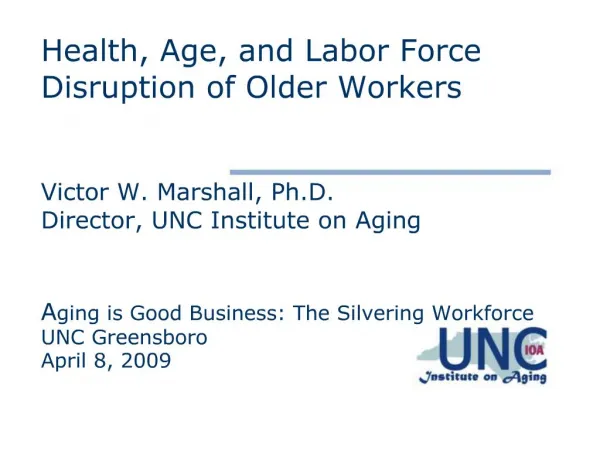
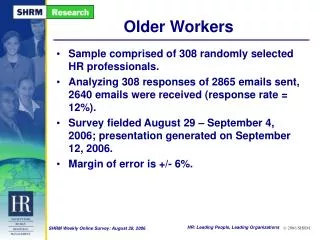
Health, Age, and Labor Force Disruption of Older Workers. Victor W. Marshall, Ph.D. Director, UNC Institute on Aging. A ging is Good Business: The Silvering Workforce UNC Greensboro April 8, 2009. Overview of Presentation. Aging of Population and Graying of the Workforce

E N D
Health, Age, and Labor Force Disruption of Older Workers Victor W. Marshall, Ph.D.Director, UNC Institute on Aging Aging is Good Business: The Silvering Workforce UNC GreensboroApril 8, 2009
Overview of Presentation • Aging of Population and Graying of the Workforce • Why older workers want to stay employed • Why we need to facilitate employment of older workers • Stereotypes about Older Workers and Health • Health and Labor Force Participation • What we need to do Prepared by the UNC Institute on Aging
Trends in Workforce Aging • Global Aging of Populations • US population is relatively younger • high numbers of younger immigrants • higher fertility rates than U.S. born population • decrease the median age • Median age of the US labor force increasing • 1986- 35.4 • 2006 -40.8 • 2016- 42.1 ( projected) Prepared by the UNC Institute on Aging
U.S. Population Pyramids 2000 2020 Source of charts: U.S. Census Bureau, “65+ in the United States: 2005,” December 2005.
Projected Population Changes 2005-2025 • The population age 25-54 will grow from about 126 million to almost 131 million. • The population age 55 and over will grow at a much faster rate, from about 67 million to nearly 105 million. Source: Patrick Purcell, Older Workers: Employment and Retirement Trends, CRS Report for Congress, September 14, 2005.
Employment Trends: Ages 25-54Labor Force Participation Rates, 1950-2005 Sources of data: Patrick Purcell, Older Workers: Employment and Retirement Trends, CRS Report for Congress, September 14, 2005; U.S. Census Bureau, Statistical Abstract of the United States, 2007.
Employment Trends: Ages 55-64 Labor Force Participation Rates, 1950-2005 Sources of data: Patrick Purcell, Older Workers: Employment and Retirement Trends, CRS Report for Congress, September 14, 2005; U.S. Census Bureau, Statistical Abstract of the United States, 2007.
Employment Trends: Ages 65+Labor Force Participation Rates, 1950-2005 Sources of data: Patrick Purcell, Older Workers: Employment and Retirement Trends, CRS Report for Congress, September 14, 2005; U.S. Census Bureau, Statistical Abstract of the United States, 2007.
Percent Increase in Employment by Age and Gender, 1977-2007 Greater % increase in older workers, older female workers. Prepared by the UNC Institute on Aging
Projected Graying of the Workforce Prepared by the UNC Institute on Aging
Older Workers Expect to Stay in the Workforce • 70 to 75% of Americans expect to work to some extent after retirement (Merrill Lynch, 2005;Rutgers, 2008). • With deteriorating economic conditions 45% of Americans believe they will retire at a later age than they originally expected (Gallup, 2008) Prepared by the UNC Institute on Aging
Older Workers: Profile • Older workers tend to be healthier, more prosperous, and better educated than their retired counterparts. • Many factors influence decisions to remain in the labor force. • Individual or family financial situations, based on general economic conditions, access to Social Security and pension benefits, and the availability of health insurance. • Personal situations, e.g., health and their enjoyment of work. Sources: Patrick Purcell, Older Workers: Employment and Retirement Trends, CRS Report for Congress, September 14, 2005; U.S. Census Bureau, “65+ in the United States: 2005,” December 2005.
Older Workers and non-traditional work arrangements • As they transition to retirement, older workers are more likely to work part-time, be self-employed, or engage in other nontraditional employment arrangements. Sources: Patrick Purcell, Older Workers: Employment and Retirement Trends, CRS Report for Congress, September 14, 2005; U.S. Census Bureau, “65+ in the United States: 2005,” December 2005.
Why Work Beyond “Normal” Retirement? • AARP study of work after retirement: • Need the income – 76% • Enjoy working/stay connected to others – 70% • Need for health benefits – 61% • Desire to stay mentally active, keep learning, and be useful – 52% (AARP 2008) Prepared by the UNC Institute on Aging
Limited Savings for Older Workers* • Savings & Investments, workers aged 55+ • Less than $10,000 28 % • $ 25,000 8 % • $ 50,000 7 % • $ 100,000 16 % • $ 250,000 18 % • $ 250,000 + 23 % • Source: Employee Benefit Research Institute, Bureau of Labor Statistics, 2008. (excludes value of home & pension plans) Prepared by the UNC Institute on Aging
Changes in Retirement Benefits Prepared by the UNC Institute on Aging
Changes in Retirement Benefits • Over the last 2 decades companies have shifted from traditional pensions to 401(k)’s, transferring retirement costs from companies to employees. (Greenhouse, 2008) • “For too many Americans, 401(k) plans have become little more than a high stakes crapshoot.” (George Miller, Chair, House Education and Labor Committee, Feb. 2009) • Workers have lost $2 trillion in 401(k)’s in the last 15 months. (Congressional Budget Office, 2009) • “Just social security and 401(k) plans will not give retirees enough money.” (Alicia Munnell, Center for Retirement Research, Boston College, 2009) Prepared by the UNC Institute on Aging
Reemployment Experiences of Older Workers Age groupReemployment rate 20-24 66% 25-54 75% 55-64 61% 65+ 25% *Source: GAO, 2007 ·Older workers are more likely than younger workers to be displaced ·Less likely to get another job ·It takes them longer to get another job ·Workers under 50 are 42% more likely to get an interview than those 50+ (Lahey, 2005) Prepared by the UNC Institute on Aging
Reemployment Consequences for older workers • Greater earning losses than younger workers • Dislocated workers with 20 years of experience find jobs paying between 20-40% less than their previous job • Fewer employment opportunities in a narrower range of industries and occupations than younger workers(Heidkamp and Van Horn, 2008) • Older men, especially those laid off in male dominated manufacturing industries, are disproportionately represented in the long-term unemployed (lasting more that 6 months) Prepared by the UNC Institute on Aging
Older Adult Unemployment, 2007-2009 Source: www.urban.org/retirement_policy/url.cfm?ID=411846 (Bureau of Labor Statistics 2009b data)
Older Workers’ Part-time and Full-time Employment • Between 1990 and 1995 increase in part-time work and decline in full time work • Between 1995 and 2007 older workers on full-time schedules doubled, while part-time workers increased only 19% • By 2007 56% of older workers full time; trend likely to continue (Bureau of Labor Statistics, 2008) Prepared by the UNC Institute on Aging
Older Workers’ Part-Time and Full-Time Employment Part-time Full-time Prepared by the UNC Institute on Aging
Why we need to facilitate employment among older workers • Many of them want to work or need to work • We need people to work longer because the large baby boom cohort is passing into retirement • The need is greater in some sectors than others • Labor force disruption has negative health consequences I WILL NOW FOCUS ON THE WORK AND HEALTH RELATIONSHIP
Barriers: Ageism and Age Discrimination • National studies of employers show barriers to hiring and retaining older workers: • Employers wrongly assume older workers are more expensive due to • Compensation • Costs of health insurance • Costs of training • Lower production and lower quality work than younger workers • Resistance to change • Employers also fear age discrimination lawsuits in laying off recently hired older workers (GAO, 2007) Prepared by the UNC Institute on Aging
Countering Age Discrimination • Ageism (attitudinal) is not the same as Age Discrimination (behavioral) • Perceived age discrimination alone can lead to mental health problems (Yuan 2007) • “Older” job seekers 40% less likely to get interview (Lahey 2005) • Ageism related to concerns about health and ability to adapt to technological and organizational change
How true are the stereotypes? • Realistically, there are aging-associated health issues • But these are too frequently exaggerated
Percent of Population that is Obese (BMI equal to or greater than 30) by Age, Selected Years. Percent (%) Data source: The National Health and Nutrition Examination Survey
Note: The need for assistance with activities of daily living was not asked of children under 6 years. Source: Brault, Matthew W. “Americans with Disabilities: 2005” (2008) Current Population Reports in U.S. Census Bureau, survey of Income and Program Participation, June-September 2005.
Life Expectancy at Age 65 by Sex and Race/Ethnicity, 1950-2003 Years Data Source: The National Vital Statistic System
Average Length of Hospital Stay (in days) by Age, 1970-2004 Average length of stay in days Data Source: The National Hospital Discharge Survey
Current Cigarette Smoking by Age and Sex, 1965-2005 Percent (%) 1965 1975 1995 1985 2005 Data source: National Health Interview Survey
Older Adults Report Being Healthier • Older adults reporting excellent or good health Source: National Center for Health Statistics, 2008. Prepared by the UNC Institute on Aging
Schematic:performance ability and agemost people will retire or reach very advanced age before declines in ability fall below levels needed for their job
Are Older Workers Less Productive? • There is no evidence that older workers’ performance and the importance of their accumulated knowledge do not compensate for their higher cost (ILO, 2005). • …”Older workers can be as productive as younger workers, especially if we increase job flexibility and design jobs suitable for them” (Victor Marshall, UNC-Institute on Aging, 2008). Prepared by the UNC Institute on Aging
Chesley Sullenberg: An Older Worker (Age 58) • Pilot license at age 14; “Best aviator in class, Air Force Academy; Commercial pilot since 1980 • Co-pilot, Jeffrey Skiles, Age 49, flying since age of 15; 20 years experience as commercial pilot • Prior to 1959: no mandatory retirement age in US for pilots • 1959: imposed age 60 but in 2007 FAA approved age 65 (LICAO requires one pilot to be under age 60 for international) • Research on Air Traffic Controllers: Experience can compensate for declines in cognitive function that might otherwise appear with aging (Nunes & Kramer (2009), Journal of Experimental Psychology: Applied 15 (1): 12-24
Health and Labor Force Disruption • The relationship between retirement and health • Health problems cause labor force disruption • Labor force disruption causes health problems • Recent reports show U.S. workers aged 50+ experience a disproportionate share of involuntary job loss
Consequences of Loss of Work • Loss of earnings– a social determinant of health • Poorer job quality in replacement jobs • Forfeiture of health and pension benefits • Reduced social involvement • Harmful health behaviors • Anxiety and other mental health problems • Increased physical disability at two years post-loss (stronger effects in women than men) • Source: Gallo, et al., and several studies they cite in Research on Aging 31 (3), May 2009
Consequences of Instability in Labor Force Participation:The Bell Canada Retiree Study • MALE AND FEMALE , ‘early retirees’ from Bell Canada who experienced more post-retirement unemployment periods (greater labor force instability) and experienced higher perceived stress • The effects were stronger for women than for men • MEN who anticipated working post-retirement from Bell but did not (violated expectations) were more likely to report life stress and low life satisfaction Source: V. Marshall, P. J. Clarke, & P. Ballantyne. (2001. Instability in the retirement transition, Research on Aging 23 (4): 379-409
What we need to do: To promote working longer • Reverse the idealization of early retirement (we will need the labor of older workers for economic growth) • Create Flexible Working Arrangements
What we need to do: To promote health • Create age-friendly workplaces • Age-mixed teams • Mentoring • Better ergonomics • Retrain and Reassign for age-appropriate jobs • Increase workplace health promotion programs • Training for transitions into retirement
Aging Workforce Initiatives,UNC Institute on Aging • Applied research, e.g., case studies at the company level • Aging Workforce Interest Group • Seminars • Digital Library • “Pub Alerts” on the aging workforce, Frontline Healthcare Workers, Health Promotion and Healthy Aging, and Lifelong Learning and Engagement • Available at www.aging.unc.edu or by contacting Dr. Peter J. Stein, Associate Director, Aging Workforce Initiatives pjstein@schsr.unc.edu