Download
1 / 14
140 likes | 219 Vues
Added value brought by AUV’s in the surveillance of exploited marine sand banks. G.Pichot, A.Norro, J.Ozer MUMM. Sources of error. International Hydrographic Norms. In coastal areas for 20 meters depth - horizontal accuracy : 6 meters - depth accuracy : 0.564 meters.

E N D
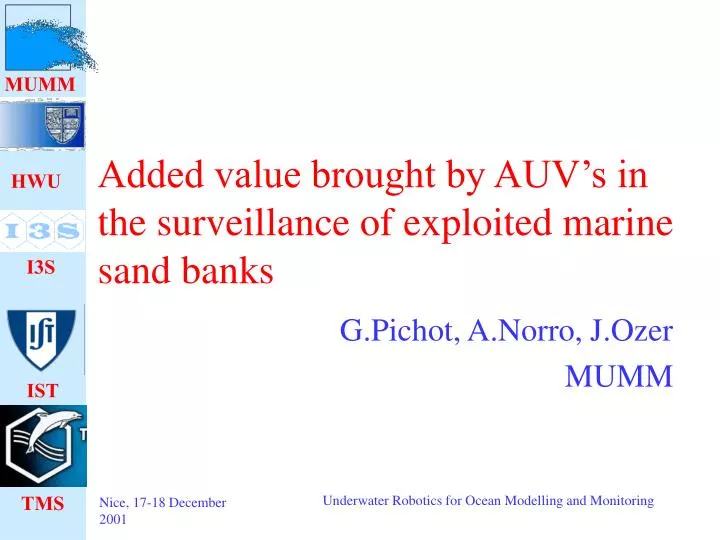
Added value brought by AUV’s in the surveillance of exploited marine sand banks G.Pichot, A.Norro, J.Ozer MUMM Underwater Robotics for Ocean Modelling and Monitoring
Sources of error Underwater Robotics for Ocean Modelling and Monitoring
International Hydrographic Norms In coastal areas for 20 meters depth - horizontal accuracy : 6 meters - depth accuracy : 0.564 meters Underwater Robotics for Ocean Modelling and Monitoring
The tidal reduction problem H = H mes. - H T. Underwater Robotics for Ocean Modelling and Monitoring
Transects over the Kwintebank (provided by MUMM)rG19 - rH01 centimeters centimeters meters meters Underwater Robotics for Ocean Modelling and Monitoring
The I3S approach • Shape of the bank is stable • Profiles are re-aligned wrt first profile • A constant offset (vertical) and a constant horizontal shift are determined • Criteria : minimisation of the distance wrt first profile Underwater Robotics for Ocean Modelling and Monitoring
Alignment correction : histogram of the observed vertical offset Compatible with the systematic part of the error budget Underwater Robotics for Ocean Modelling and Monitoring
Deviation wrt the mean profile (rG19) Error max 100 cm compatible with the random part of the error budget -100 -50 0 50 100 (cm) Underwater Robotics for Ocean Modelling and Monitoring
Deviation wrt the mean profile (rG21 and rH01) -200 -100 0 100 200 (cm) 150 100 50 0 50 100 150 (cm) 200 100 0 100 200 rG21 error max 250 cm rH01 error max 150 cm MUMM’s random error budget explains only 100 cm Underwater Robotics for Ocean Modelling and Monitoring
Volume consideration Should a part of the volume variation be extracted from a trend in the alignement ? Underwater Robotics for Ocean Modelling and Monitoring
Do we need a tidal reduction ? Underwater Robotics for Ocean Modelling and Monitoring
Offset with non tidally reduced data Underwater Robotics for Ocean Modelling and Monitoring
Conclusion With non tidally reduced data Win one third of the systematic error Increased offset making the trend identification more difficult Interest to compare or to combine the two approaches Underwater Robotics for Ocean Modelling and Monitoring
Conclusion(2) Need more data Underwater Robotics for Ocean Modelling and Monitoring


![EVM System Surveillance Presented By: [NAMES] Presented to: [GROUP]](https://cdn2.slideserve.com/3705648/slide1-dt.jpg)