Download
1 / 41
420 likes | 716 Vues
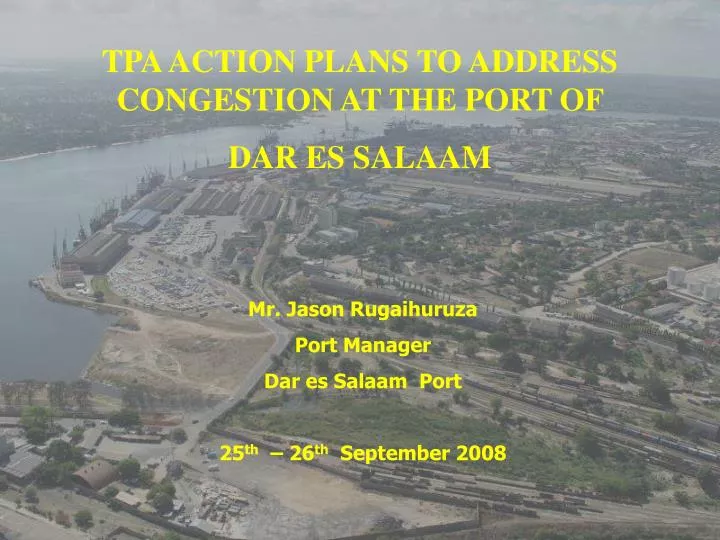
TPA ACTION PLANS TO ADDRESS CONGESTION AT THE PORT OF DAR ES SALAAM. Mr. Jason Rugaihuruza Port Manager Dar es Salaam Port 25 th – 26 th September 2008. AN OVERVIEW INTRODUCTION PORT CONGESTION 3. MAIN CAUSES OF CONGESTION 4. DECONGESTING STRATEGIES

E N D
TPA ACTION PLANS TO ADDRESS CONGESTION AT THE PORT OF DAR ES SALAAM Mr. Jason Rugaihuruza Port Manager Dar es Salaam Port 25th – 26th September 2008
AN OVERVIEW • INTRODUCTION • PORT CONGESTION • 3. MAIN CAUSES OF CONGESTION • 4. DECONGESTING STRATEGIES • 5. ACTION PLANS TO ADDRESS PORT CONGESTION • 6. CHALLENGES
1. INTRODUCTION 1.1 DSM Port berths • Total berths: 11 and lighter quay • Total quay length: 2,600m 1.2 Port Terminals • General Cargo Terminal - 8 berths • Container Terminal – 3 berths • Oil terminals • SPM • KOJ I & II • Grain Terminal
1.3 Transit corridors: The transit corridors served by the port of Dar-es-Salaam are TAZARA corridor, Central corridor, Tanga corridor and Mtwara corridor. These corridors are supported by road, rail, lake or/and pipeline transport system.
4 D R CONGO 3 2 1 NB: 1- Mtwara corridor, 2- DSM TAZARA corridor, 3- DSM Central corridor, 4- Tanga corridor
2. PORT CONGESTION • 2.1 Port started to experience congestion end of year 2006, and severe congestion was from November 2007. • 2.2 Main congestion indicators include: • (a) Long waiting times for ships at outer anchorage, and high ship turnround times.
(i) Waiting time (days/ship) GCT – General Cargo Terminal CT – Container Terminal
(ii) Turnround time (Days/ship) GCT – General Cargo Terminal, CT – Container Terminal Long ship turnround times since 2006, indicates slow quay and yard operations. This is a sign of congestion of ships at outer anchorage and congestion of containers in the terminal.
(b) High berth occupancy rates The berth occupancy for Container Terminal for year 2007 and 2008 level above 60% which is a sign of congestion.
(c) High dwell times of containers The dwell time for the terminal from the design perspective was 10 days. The actual dwell time as shown above indicates that containers overstay in the terminal thus creating congestion and slowing down operations.
(d) Lower crane productivity (moves per crane net hour) The crane productivity has been falling down since 2006, an indication of long ship waiting times, turnround times and yard congestion.
3. MAIN CAUSES OF CONGESTION 3.1 Insufficient container storage space. The Container Terminal intrinsic capacity is 250,000 TEUs per annum. This capacity was surpassed in year 2004, where the Terminal handled throughput of 259,369 TEUs. In year 2007, the Terminal handled 343,436 TEUs, surpassing its designed capacity by 37.4%.
3.2 Long container dwell times Long Container dwell times have direct impact on Terminal capacity. The higher the dwell time the lower the capacity, resulting in yard congestion. Based on current Container Terminal area of 3,157 groundslots.
3.3 Sharp increase of container volumes Containerized cargo traffic trend has been reflecting a positive increase of 15.1% per annum as from year 2000 to 2007. In year 2007, the proportion of containerized cargo to dry cargo traffic was 62%, as compared to 48% in year 2000.
3.4 Poor inland transport: • Many roads are not fully paved (85% of the roads) resulting in long travel times. • Low availability of locomotives and rolling stock. • TRL : 1.0 metres gauge, with capacity of 2.5 million tons and achieving less than 30% per annum. • TAZARA: 1.067 metres gauge, with capacity of 5 million tons, and achieving less than 12% per annum.
(i) Cargo clearance (in ‘000 metric tons) The Cargo clearance by all modes has been increasing by 9.5% per annum since 2000. Clearance by road has been increasing by 12.5% while by rail has been declining by 6.8%.
(ii) Cargo clearance (in ‘000 tons) and percent share by modes The share of cargo cleared by road has been keeping on rising while that of rail has been falling. The shortage of wagons contributes to decline of cargo clearance share compared to road mode of transport.
4. DECONGESTING STRATEGIES 4.1 Increase of Container Terminal capacity (groundslots) and use of Inland depots. 4.2 Better utilization of terminal capacity within the port (equipment, workforce, space, procedures, IT). 4.3 Joint effort by stakeholders to reduce dwell time of cargo in the port.
5. ACTION PLANS TO ADDRESS PORT CONGESTION 5.1 Short-term measures
5.4 Short term Action plans implementation results:(a) Container stock level Short term action plans implementation have shown positive results by reducing congestion of the containers at the terminal from stock level of 11,714 TEUs mid-February 2007 to 6,315 TEUs mid-March 2007. Stock level increased again to 7,897 TEUs mid-September 2008. The terminal holding capacity is 7,500 TEUs. The number of import containers at the terminal has significantly declined from 7,521 TEUs beginning of February 2008 to 4,021 TEUs mid-September 2008.
(b) Ship at outer anchorage Number of ship at outer anchorage has decreased from 14 vessels per day beginning of February 2007 to 0 vessels beginning of September 2008.
6.0 CHALLENGES • 6.1 Creating port capacity ahead of demand. • 6.2 To handle the increasing general cargo, bulk cargo and container traffic. • 6.3 Coordination with inland transport modes through business corridors to achieve high utilization of available capacity and seamless transfer of cargo along the entire logistic chain. • 6.4 To continue improving port facilities and capacity in order to handle efficiently the increasing traffic.
6.5 Inter-connectivity and cooperation with other ports to face challenges of traffic increase. 6.6 Setting up a good port community system with the challenge of promoting port efficiency, cost effectiveness and marketing. The Port Community system entails exchange of information on cargo and vessels among stakeholders. This will also involve information on port related activities such as booking of wagons. 6.7 To improve security and safety of people, cargo, port facilities and vessels in accordance with ISPS code.
7.8 To continue creating a productive and motivated workforce and manage the intellect created in the workforce. 7.9 To complete and implement the Port Master Plan study.
THANK YOU FOR YOUR ATTENTION