Download
1 / 59
690 likes | 921 Vues
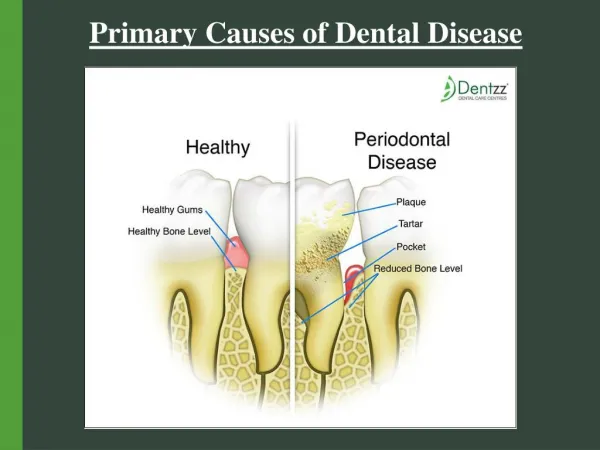
Etiologic research Study of the causes of disease. Dr.dr. Siti Setiati, SpPD(K). Major Types of Clinical Epidemiologic Research. Etiologic research. The research question Is there a relation between a determinant (risk factor) and a disease-outcome? Research question for causal relation!.

E N D
Etiologic researchStudy of the causes of disease Dr.dr. Siti Setiati, SpPD(K)
Etiologic research The research question • Is there a relation between a determinant (risk factor) and a disease-outcome? • Research question for causal relation!
Etiologic researchCharacteristics • Explanatory research • versus descriptive research • To demonstrate causality (cause-effect) • Cause comes before effect • Exposure and determinant occurs before the disease-outcome occurs • Determinant-outcome relation is not explained by other factors
Etiologic researchWhat study design? • Experimental • Exposure or determinant assigned by investigator versus • Observational • Exposure or determinant not assigned by investigator This lecture: observational research
HILL’S CRITERIA • Is it clear that the exposure precede the onset of the outcome ? • Is there a dose-response gradient? • Is the association consistent from study to study • Does the association make biological sense?
Etiologic research What study design? • Design of two observational studies to distinguish between cause and effect: • Cohort study • Case-control study
Cohort study • Also called follow-up study • Definition • Study in which persons, based on their exposure todeterminant and free of the disease outcome at the start of the study, are followed in time to assess the occurrence of the disease outcome.
Cohort study disease + cohort without disease outcome determinant + disease - disease + determinant - disease - time start study disease-outcome
Framingham Heart Study • 1948 – Framingham, MA • 5200 persons 30-62 years old • Aim: identification of risk factors for cardiovascular diseases • Remeasured every 2 years Example of a research question: Is hypertension a risk factor for MI?
Framingham Heart Study MI + cohort without myocardial infarction hypertension + MI - MI + hypertension - MI - time 1948 1998
Cohort studydeterminant-outcome relation MI + MI - hypertension + a b a/a+b=probability of MI for hypertension + = Incidence+ hypertension - c d c/c+d=probability of MI for hypertension - = Incidence - Relative Risk (RR) = incidence + / incidence -
Cohort study How do you get a cohort? • Geographical (Framingham Heart Study) • Birth cohort (British 1946 birth cohort) • Dynamic cohort (Leidsche Rijn) • Occupational cohort (Whitehall study)
Cohort study How do you follow the cohort? How do you find the disease-outcome? • After a certain time interval, send out a questionnaire or invite for interview or medical examination • Record disease outcomes via medical files or registrations
Prospective Cohort Start here Exposure Outcome + ** Free of outcome - * + - to t1
Historical Cohort Start here Exposure Outcome + ** Free of outcome - * + - to t1
Cohort studysummary determinant disease-outcome
Case-control study • Also called patient-control study • Definition • Study in which patients with the disease-outcome and a control group without the disease-outcome are selected and in which it is determined how many people in both groups have been exposed to the determinant
Case-control study determinant + disease + (patients) determinant - determinant + disease – (controls) determinant - time start study
Creutzfeldt-Jakob’s Disease • Fast, progressive form of dementia • In the 90s a new variant of Creutzfeldt-Jakob was discovered in Europe after an epidemic of mad-cow disease • Caused by eating beef? What research question? Why case control?
Creutzfeldt-Jakob’s Disease beef + patients with CJD beef - beef + controls from hospital beef - time start study
Case-control studydeterminant-outcome relation CJD + CJD - beef + a b beef - c d Odds Ratio b/d = odds beef+ in controls a/c = odds beef+ in cases = a x d / b x c
Case-control study How do you find patients? • GP; hospital; cancer registration How to select a control group? • GP; hospital; general population • Patients and controls have to come from the same ‘source’ population.
Case-control study How do you assess exposure to determinant? • Interview with participant • Interview with proxy • Medical file
Case Control Exposure Outcome Start here + Case - Population + Control -
Case-control studysummary determinant disease-outcome
Measures of association:Case Control approach • Research question: Does smoking increase the risk of lung cancer ? • Patient control study • select cases and controls • Estimate the frequency of smoking among cases and controls • prior: % smokers among cases > % smokers among controls
Measures of association: Case Control approach Disease Yes No Yes a b Determinant No c d • RR? • Odds ratio = (a/c) / (b/d) = ad / bc
OR and RR • In a randomized trial or Cohort study: • Relative Risk (RR) = [a/(a+b) / c/(c+d)] • In a case-control study: • Odds Ratio (OR) = (a/b) / (c/d) = ad/bc • Odds ratios (OR) and relative risk (RR) greater than 1 indicate that there is an increased risk of the adverse outcome associated with the exposure. • If OR = RR = 1 the adverse outcome is no more likely to occur with than without exposure to the suspected agent.
Example 1 (Risk Ratio) In the randomized prospective Heart Outcomes Prevention Evaluation (HOPE) study (1) the effect of Ramipril on the risk of cardiovascular (CV) events was investigated by calculating the ratio between the incidence proportions of CV events in Ramipril treated and in placebo treated patients. With CV events Without CV events Ramipril group (n=4645) 651 3994 Placebo group (n=4652) 826 3826 Relative measures of effect • The relative risk • The relative risk can be calculated as ratio between two incidence proportions (risk ratio, see Example 1) or two incidence rates (incidence rate ratio, see Example 2). - Proportion of patients with CV events in the Ramipril group: 651/ 4645=0.14 (14%). - Proportion of patients with CV events in the placebo group: 826/ 4652=0.18 (18%). The RiskRatio(RR) is: 0.14/0.18= 0.78 The Heart Outcomes Prevention Evaluation Study Investigators. Effects of an angiotensin-converting-enzyme inhibitor, ramipril, on cardiovascular events in high-risk patients. N Engl J Med 2000; 342: 145-153
Relative measures of effect • The odds ratio • The odds are a way of representing probability, familiar to gamblers (for example, the odds that a single throw of a die produces a six are 1 to 5). In a case-control study the odds of exposure in cases and controls are calculated as the number of exposed individuals divided by the number of unexposed individuals in each group. If we know the odds of exposure in cases and controls we can calculate the odds ratio (OR), i.e. the ratio between the odds of exposure in diseased and in non-diseased individuals. Example 2 (the odds ratio) Knoll et al. (3) investigated the association between vascular access thrombosis and thrombophilia. They considered 107 patients with access thrombosis (cases) and 312 patients without fistula thrombosis (controls). Overall, among the 107 patients with access thrombosis, 59 had evidence of thrombophilia and 48 did not while among the 312 without access thrombosis 122 had thrombophilia and 190 did not. - Odds of thrombophilia in patients with vascular access thrombosis : 59/48=1.229 - Odds of thrombophilia in patients without vascular access thrombosis : 122/190=0.642 The odds ratio (OR) is: 1.229/0.642= 1.91 Knoll GA, Wells PS, Young D, et al. Thrombophilia and the risk for hemodialysis vascular access thrombosis. J Am SocNephrol 2005;16:1108-1114.
Measures of association:Case Control approach • Smoking and lung cancer (controls = 10% random sampling from cohort) Disease Yes No Yes 440 300 740 Determinant No 212 350 562 • Odds ratio (440/212) / (300/350) = 2.42 • RR = (440/740) / (212/562) = 1.57 (shouldn’t be calculated)
Measures of association:Cohort approach • Research question? Is smoking associated with lung cancer? • Cohort approach • divide the cohort in smokers and non-smokers • estimate the incidence density (or CI) in each group • prior: ID smokers > ID not smokers
Measures of association: Cohort approach Disease Yes No Yes a - PY1 Determinant No c - PY0 a/py1 RR = c/py0
Measures of association: Cohort approach • Smoking and lung cancer Disease Yes No Yes 440 - 22.008 py Determinant No 212 - 21.235 py RR = (440/22.008) / (212/21.235) = 2.0
The Rules are • The RR will always be closer to 1.0 than the OR. • If the baseline risk (the risk of adverse events in the controlgroup) is low (say, less than 30%), the difference betweenRR and OR is unlikely to be important. Therefore, the twomay be used interchangeably for interpreting results. • If the OR is near 1.0, the difference between RR and OR is unlikely to be important. • Following directly from the above, the only time you arelikely to run into trouble treating the OR as an RR is whenthe baseline risk is high (over 30%) and the OR is not closeto 1.0 (say less than 0.67 or greater than 1.3). Under thesecircumstances, the RR is likely to be appreciably closer to 1.0 than the OR.
Cohort studyAdvantages and disadvantages • What are the advantages of a cohort study? • What are the disadvantages of a cohort study?
Cohort study • Advantages • Cause is measured before effect • Not very sensitive to selection- and information bias • Appropriate for rare determinant • Can study several outcomes • Disadvantages • Selective withdrawal / loss to follow-up • Expensive and time consuming • Not appropriate for rare outcome
Case-control studyAdvantages and disadvantages • What are the advantages of a case-control study? • What are the disadvantages of a case-control study?
Case-control study • Advantages • Efficient and relatively cheap • Appropriate for rare outcome • Can study several determinants • Disadvantages • Cause is measured after effect • Very sensitive to selection- and infobias • Not appropriate to study several outcomes
ADVANTAGES AND DISADVANTAGES OF CASE CONTROL STUDIES Advantages: 1. only realistic study design for uncovering etiology in rare diseases 2. important in understanding new diseases 3. commonly used in outbreak investigation 4. useful if induction period is long 5. relatively inexpensive
Disadvantages: 1. Susceptible to bias if not carefully designed (and matched) 2. Especially susceptible to exposure misclassification 3. Especially susceptible to recall bias 4. Restricted to single outcome 5. Incidence rates not usually calculable 6. Cannot assess effects of matching variables
PICO • P = Patient / Population / Problem • I = Intervention / Indicator / Index • C = Comparation (if relevant) • O = Outcomes
Example Susan is expecting her first baby in two months. She has been reading about the potential benefits and harms of giving newborn babies vitamin K injections. She is alarmed by reports that vitamin K injections in newborn babies may cause childhood leukaemia. She asks you if this is true and, if so, what the risk for her baby will be. Type : Aetiology P : newborn babies I : vitamin K injection C : - O : Risk of childhood leukaemia
VIA methods • Validity: type of study, blinded?, number of subjects?, controlled? • Importance: result? • Applicability: patient’s characteristic
Is our patient so different from those in the study that its results cannot apply? • Randomization would tend to make the two treatment groups identical for all other causes of disease. • Unfortunately, the validity of the study designs used to detect harm is inversely proportional to their feasibility (in size, duration, and ethics) • If the study was not randomized, try to compare the two groups’ baseline data. We have to be careful with confounders .
Were treatments/exposures and clinical outcomes measured in the same ways in both groups? • We’d feel more assured about the study if the report described that the patients (and the interviewers) were blinded to the study hypothesis