Download
1 / 48
480 likes | 603 Vues
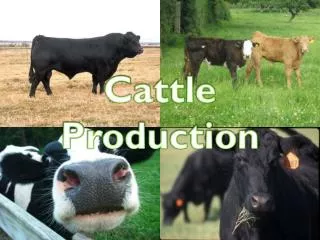
What’s The Cattle Price Outlook For 2006?. Dr. Walter Prevatt Dr. Deacue Fields Extension Economists Auburn University. Cattle Situation and Outlook. U.S. Cattle and Calves Inventory, 1949-2006. Million Head. Cattle & Calves Inventory. Year.

E N D
What’s The Cattle Price Outlook For 2006? Dr. Walter Prevatt Dr. Deacue Fields Extension Economists Auburn University
U.S. Cattle and Calves Inventory, 1949-2006 Million Head Cattle & Calves Inventory Year
U.S. Cattle and Calves Inventory, 1949-2006 Million Head Cattle & Calves Inventory 1949-58 1958-67 1967-79 1979-90 1990-04 Year
Length of U.S. Cattle Cycles Million Head 1967-79 1958-67 2004-? 1979-90 1990-04 1949-58 Number of Years
U.S. Cattle Inventory & Average Calf Price 1949-2006 Million Head Year
U.S. Cattle and Calves Inventory,97.1 Million Head, Jan. 1, 2006
Percent Change From A Year Ago In U.S. Inventory, Jan. 1, 2006
U. S. Beef Production, 1975-2006 * Estimated
U.S. Average Cattle Carcass Weights, 1975-2005 Factors affect carcass weights include genetics, marketing technology, corn prices, grid pricing, fed cattle prices, breakeven prices, etc.
U.S. Cattle Operations, Number by Size Group, 2005 982,510 U.S. cattle operations, 2005
U.S. Cattle Operations & Inventory, Percent by Size Group, 2005 Cattle Operations Cattle Inventory
Cattle Situation and Outlook Demand Situation
U.S. Per Capita Meat Consumption,Retail Weight Basis, 1976-2006
U.S. Per Capita Meat Consumption,Retail Weight Basis, 1976-2006
Cattle Situation and Outlook Cost of Production
U.S. Cow-Calf Cash Expenses, 1972-99 *1990-99 estimates were based on a revised methodology.
Stocker Gross Margin, Alabama, October-April, 400# -750#, 1979-2006 Gross margin is feeder sale value minus stocker purchase value. Based on steers, med. & lrg., No. 1, Oct. to Apr., 400 to 750 pounds.
Monthly Feeding Cost of Gain700 to 800 Lb. Steers in Kansas Source: KSU Cattle Return Series
Cattle Situation and Outlook Market Prices
Alabama Feeder Calf Prices,Steers, Med. & Lg., #1, 1990-2006
Annual U. S. Beef Production, 2000-06 *Estimated
Annual U.S. Beef Production &Average Fed Beef Price, 2000-2006
Quarterly U. S. Beef Production, 2004-06 *Estimated (2004 -> 24.5B, 2005 -> 24.7B, 2006 -> 25.9B*)
Quarterly U. S. Beef Production & Average Fed Beef Price, 2004-2006 *Estimated
2006 Cattle Price Projections, $/Cwt. These projections will be revised as new economic information is received and processed.
Cattle Situation and Outlook Profit Potential
U.S. Cow - Calf Returns Over Cash Expenses, 1972-99 Source: USDA
Average Annual Cow-Calf ReturnsOver Cash Expenses, 1980-2004 Source: Cattle-Fax
Average Annual Stocker CattleReturns Over Cash Expenses, 1980-2006 Source: Cattle-Fax Includes winter and summer grazing programs.
Monthly Returns for Finishing 700 to 800 Lb. Steers in Kansas Source: KSU Cattle Return Sales
Average Annual Cattle Feeding Returns, 1980-2004 Source: Cattle-Fax
Cattle Situation and Outlook Summary Remarks
Cattle Situation and Outlook Greed, Fear, and Weather
Alabama Feeder Calf Prices,Steers, Med. & Lg., #1, 1990-2006
Projected Profit/Loss By Cattle Industry SegmentsDuring The Four Price Phases Of The Cattle Cycle* The information in this chart is generalized based on the price phase of the cattle cycle. These projections will be revised as new economic information is received and processed.
What’s The Cattle Price OutlookFor 2006 Dr. Walter Prevatt Dr. Deacue Fields Extension Economists Auburn University