Download
1 / 17
170 likes | 274 Vues
Food price volatility: L ong-term trends and outlook for child undernutrition in Africa. Will Masters Professor and Chair, Department of Food and Nutrition Policy Friedman School of Nutrition Science and Policy, Tufts University www.nutrition.tufts.edu sites.tufts.edu/ willmasters.

E N D
Food price volatility:Long-term trends and outlook forchild undernutrition in Africa • Will Masters • Professor and Chair, Department of Food and Nutrition Policy • Friedman School of Nutrition Science and Policy, Tufts University • www.nutrition.tufts.edu • sites.tufts.edu/willmasters McGill Conference on Global Food Security 5 October 2011
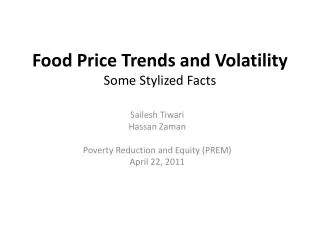
Food price volatility today: Two spikes, and a new plateau? Monthly average prices for wheat, maize and rice, Jan. 2000-Sep. 2011 Source: FAO Global Information and Early Warning System data (www.fao.org/giews/pricetool2), downloaded Oct 3, 2011. All are monthly export prices, normalized to Jan. 2000=100, for US No. 2 Hard Red Winter Wheat, US No. 2 Yellow Maize, and Thai 100% Broken Rice.
How will people respond? Producers & consumers, activists & officials January 2011 April 2008
Can we learn from history? Share of all two-word phrases in English-language books, 1900-2008 1990-2008: The great forgetting 1900-1970: Cycling between food and farm crises 1970-1990: The green revolution Source: Computed from http://books.google.com/ngrams, 3 October 2011. Method detailed in J-B Michel et al., 2010. Quantitative Analysis of Culture Using Millions of Digitized Books. Science, Dec. 2010.
Words in books follow world food prices Share of all two-word phrases in English-language books, 1900-2008 1990-2008: Complacency Relative price of food on world markets, 1900-2005 (1977-79=100) Source: K. Anderson (2006), “Reducing Distortions to Agricultural Incentives: Progress, Pitfalls and Prospects.” <www.worldbank.org/agdistortions>. Data shown are an index of export prices in US dollars for all major traded agricultural products, deflated by the MUV index which is the unit value of manufactures exported from France, Germany, Japan, UK and US, with weights based on those countries’ exports to developing countries.
February 1917 Will we respond now as they did then? August 1918 April 1973 Relative price of food on world markets, 1900-2005 (1977-79=100) Source: K. Anderson (2006), “Reducing Distortions to Agricultural Incentives: Progress, Pitfalls and Prospects.” <www.worldbank.org/agdistortions>. Data shown are an index of export prices in US dollars for all major traded agricultural products, deflated by the MUV index which is the unit value of manufactures exported from France, Germany, Japan, UK and US, with weights based on those countries’ exports to developing countries.
Even after the Green Revolution, under-nutrition persisted… Relative price of food on world markets, 1900-2005 (1977-79=100) At the all-time low prices of 2002… March 13, 2002 World: Many Hungry Mouths Around 815 million people -- 13 percent of the world's population -- suffer from hunger and malnutrition, mostly in developing countries, said Jacques Diouf, head of the United Nations Food and Agriculture Organization. Source: K. Anderson (2006), “Reducing Distortions to Agricultural Incentives: Progress, Pitfalls and Prospects.” <www.worldbank.org/agdistortions>. Data shown are an index of export prices in US dollars for all major traded agricultural products, deflated by the MUV index which is the unit value of manufactures exported from France, Germany, Japan, UK and US, with weights based on those countries’ exports to developing countries.
Extreme under-nutrition happens • mainly in infancy, among the very poorest Mean weight-for-height z scores relative to WHO standards, by region (1-59 mo.) The most extreme under-nutrition is here, among infants aged 4-12 months Source: CG Victora, M de Onis, PC Hallal, M Blössner and R Shrimpton, “Worldwide timing of growth faltering: revisiting implications for interventions.” Pediatrics, 125(3, Mar. 2010):e473-80.
In Asia, where undernutrition was worst, we now have 30 years of improvement National trends in prevalence of underweight children (0-5 years) Selected countries with repeated national surveys Source: UN SCN. Sixth Report on the World Nutrition Situation. Released October 2010, at http://www.unscn.org.
In Africa, undernutrition has begun to improve only recently, in some countries National trends in prevalence of underweight children (0-5 years) Selected countries with repeated national surveys Source: UN SCN. Sixth Report on the World Nutrition Situation. Released October 2010, at http://www.unscn.org.
Asia has had 30 years of poverty decline;Africa’s poverty decline began 20 yrs. later Source: Author’s calculation from World Bank (2011), PovcalNet (http://iresearch.worldbank.org/PovcalNet/), updated 11 April 2011. Estimates are based on over 700 household surveys from more than 120 countries, and refer to per-capita expenditure at purchasing-power parity prices for 2005.
Africa’s green revolution is • at least 20 years behind Asia’s Source: Reprinted from W.A. Masters, “Paying for Prosperity: How and Why to Invest in Agricultural Research and Development in Africa” (2005), Journal of International Affairs, 58(2): 35-64.
The rise then fall in Africa’s child-survival baby boom is also 20 years behind Asia’s Child and elderlydependency rates by region (0-15 and 65+), 1950-2030 Africahad the world’smostseveredemographicburden (>45% ) now a demographic gift Source: Calculated from UN Population Projections, 2008 revision (March 2009), at http://esa.un.org/unpp.
The rise then fall in Africa’s rural • population growth is also 20 years later Rural population growth rates by region, 1950-2030 Over 2% annual growth for 30 years! Under 1.3% annually, and falling Below zero = more land/farmer Source: Calculated from FAOStat (downloaded 17 March 2009). Rural population estimates and projections are based on UN Population Projections (2006 revision) and UN Urbanization Prospects (2001 revision).
Conclusions on price volatility, long-term trends and outlook • The two-spike, new plateau world of price volatility is bad • Unless increased public investment deepens the green revolution • Child undernutrition and extreme poverty is worse • And it persisted into 2000s, despite low and stable food prices • Long-term trends promise gradual improvements • Asia has had 30 years of slow improvement • Africa’s trends paralleled Asia’s, but 20+ years later • Worsening and then improvement in: • poverty rates • child dependency • rural population growth • Africa has already begun to reverse its impoverishment
In Africa, undernutrition is less severe but is improving in only some countries National trends in prevalence of underweight children (0-5 years) Selected countries with repeated national surveys Source: UN SCN. Sixth Report on the World Nutrition Situation. Released October 2010, at http://www.unscn.org.