Download
1 / 1
10 likes | 80 Vues
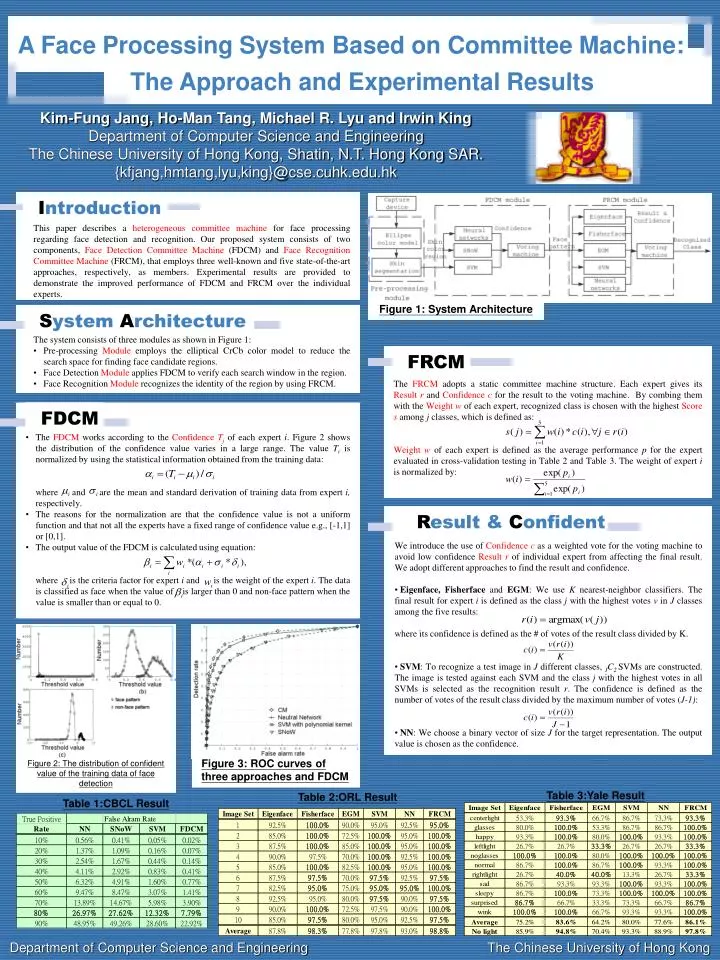
I ntroduction. FRCM. S ystem A rchitecture. R esult & C onfident. FDCM. Figure 1: System Architecture. Figure 2: The distribution of confident value of the training data of face detection. Figure 3: ROC curves of three approaches and FDCM. Table 3:Yale Result. Table 2:ORL Result.

E N D
Introduction FRCM System Architecture Result & Confident FDCM Figure 1: System Architecture Figure 2: The distribution of confident value of the training data of face detection Figure 3: ROC curves of three approaches and FDCM Table 3:Yale Result Table 2:ORL Result Table 1:CBCL Result A Face Processing System Based on Committee Machine: The Approach and Experimental Results Kim-Fung Jang, Ho-Man Tang, Michael R. Lyu and Irwin King Department of Computer Science and Engineering The Chinese University of Hong Kong, Shatin, N.T. Hong Kong SAR. {kfjang,hmtang,lyu,king}@cse.cuhk.edu.hk This paper describes a heterogeneous committee machine for face processing regarding face detection and recognition. Our proposed system consists of two components, Face Detection Committee Machine (FDCM) and Face Recognition Committee Machine (FRCM), that employs three well-known and five state-of-the-art approaches, respectively, as members. Experimental results are provided to demonstrate the improved performance of FDCM and FRCM over the individual experts. • The system consists of three modules as shown in Figure 1: • Pre-processing Module employs the elliptical CrCb color model to reduce the search space for finding face candidate regions. • Face Detection Module applies FDCM to verify each search window in the region. • Face Recognition Module recognizes the identity of the region by using FRCM. The FRCM adopts a static committee machine structure. Each expert gives its Result rand Confidence cfor the result to the voting machine. By combing them with the Weight w of each expert, recognized class is chosen with the highest Score samong j classes, which is defined as: Weight w of each expert is defined as the average performance p for the expert evaluated in cross-validation testing in Table 2 and Table 3. The weight of expert i is normalized by: • The FDCM works according to the Confidence Tj of each expert i. Figure 2 shows the distribution of the confidence value varies in a large range. The value Ti is normalized by using the statistical information obtained from the training data: • where and are the mean and standard derivation of training data from expert i, respectively. • The reasons for the normalization are that the confidence value is not a uniform function and that not all the experts have a fixed range of confidence value e.g., [-1,1] or [0,1]. • The output value of the FDCM is calculated using equation: • where is the criteria factor for expert i and is the weight of the expert i. The data is classified as face when the value of is larger than 0 and non-face pattern when the value is smaller than or equal to 0. • We introduce the use of Confidencecas a weighted vote for the voting machine to avoid low confidence Result r of individual expert from affecting the final result. We adopt different approaches to find the result and confidence. • Eigenface, Fisherface and EGM: We use K nearest-neighbor classifiers. The final result for expert i is defined as the class j with the highest votes v in J classes among the five results: • where its confidence is defined as the # of votes of the result class divided by K. • SVM: To recognize a test image in J different classes, JC2 SVMs are constructed. The image is tested against each SVM and the class j with the highest votes in all SVMs is selected as the recognition result r. The confidence is defined as the number of votes of the result class divided by the maximum number of votes (J-1): • NN: We choose a binary vector of size J for the target representation. The output value is chosen as the confidence. Department of Computer Science and Engineering The Chinese University of Hong Kong