Download
1 / 48
480 likes | 486 Vues
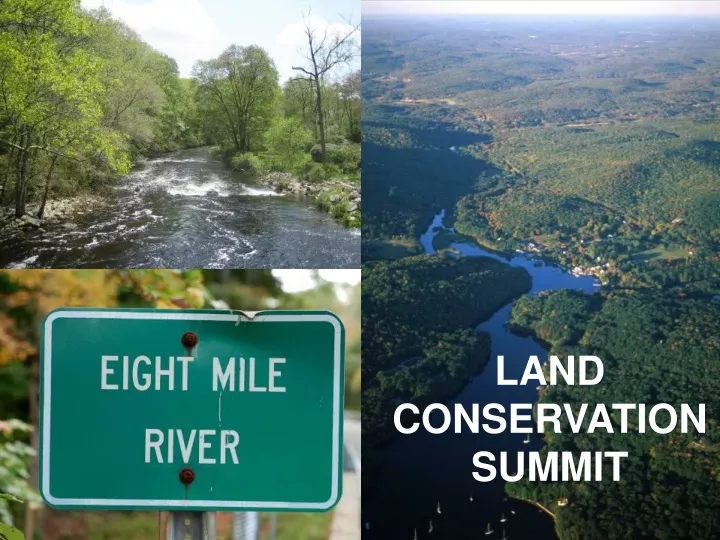
LAND CONSERVATION SUMMIT. Priorities and Goals Mapping. Conservation Matrix Layer mapping Final vision – input and discussion. MAPPABLE PRIORITIES. MAPPABLE PRIORITIES ALL FACTORS. MAPPABLE PRIORITIES ALL FACTORS. MAPPABLE PRIORITIES ALL FACTORS. MAPPABLE PRIORITIES

E N D
Priorities and Goals Mapping • Conservation Matrix • Layer mapping • Final vision – input and discussion
MAPPABLE PRIORITIES MAPPABLE PRIORITIES ALL FACTORS
MAPPABLE PRIORITIES ALL FACTORS
MAPPABLE PRIORITIES ALL FACTORS
MAPPABLE PRIORITIES TOP 4 FACTORS
MAPPABLE PRIORITIES TOP 4 FACTORS
MAPPABLE PRIORITIES TOP 4 FACTORS
ALL FACTORS TOP 4 FACTORS
VISION TO ACTION • The Unprecedented Opportunity to Realize Vision: • We can do something remarkable – conserve a watershed ecosystem • Point One: • Still have something precious to save • Outstanding watershed quality remains • Over 92% watershed intact
Point 2: • Land Conservation: • Key to Saving the Outstanding Quality
Point Three: Rate of Conservation shows “we can do it” Conservation before 1997: Acres protected: 7,386 18.5% watershed
Conservation 2008: Acres protected: 13,147 32.9% watershed
7,386: Acres preserved in the last 300+ years 5,760: Acres preserved in the last 11 years
Point 4: • We can do it despite development pressure • Protected key parcels as they came on the market
Key Examples: • Jewett 480 acres • HBD 475 acres • Firestone ~380 acres • SVC 740 acres • Litsky 120 acres • Lefebvre 120 acres • Maynard 205 acres • Plimpton 100 • Walden Preserve 420 acres • Mount Archer 280 acres • Zemko 250 acres • Urbanik 86 acres
Town Building Permits Issued: 10yrs(’98 to ’07): Lyme: 110 Salem: 220 East Haddam: 598 Total: 928 Eightmile Watershed Acreages: Undeveloped/water Developed/turf/grass Total 1985 37,506 (93.9%) 2,426 39,932 2006 36,836 (92.2%) 3,096 39,932
Comparing Conservation Rate to Development: • Conserved last 11 years: 5,760 acres • Developed last 14 years: 388 acres (includes conv to turf/grass) • Acres conserved/year >>> Acres developed/year • Conservation Rate kept well ahead of development threat: • RARE – even for priority areas
Point 5: • We can do it in a Finite period of time • Point 6: • Wild & Scenic Designation is a big boost
What lands are yet to be decided that we care about? = Vision footprint – Conserved & Developed lands
MAPPABLE PRIORITIES TOP 4 FACTORS
VISION TO ACTION • Realizing the Vision Discussion: • Lessons from Experience • Future Challenges & Opportunities
What strategies worked? • How was the success funded? • What role did partnerships, landowners and community attitudes play? • What is different today including the Market? • Steve Flannigan • What implications do we see for our organizations? • How might we work more effectively -- independently or together? • Where are the hot spots in need of our immediate attention? • Wild and Scenic new opportunity