Download
1 / 20
220 likes | 358 Vues
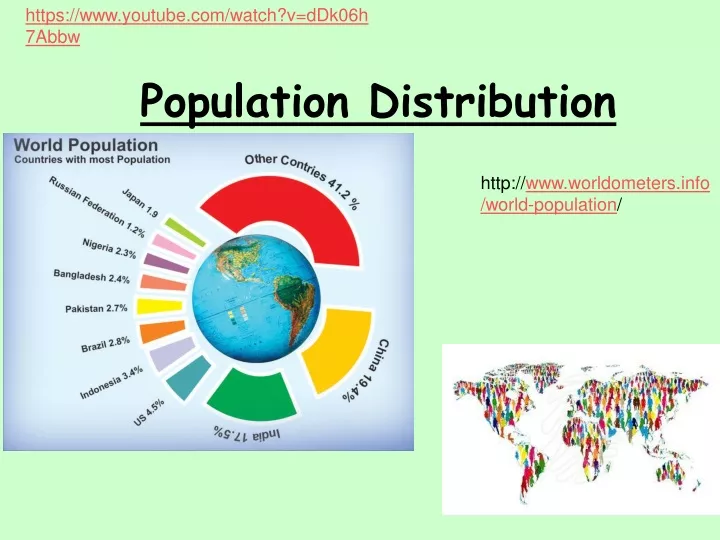
https://www.youtube.com/watch?v=dDk06h7Abbw. Population Distribution. http:// www.worldometers.info/world-population /. Lesson starter;. We are learning to…. Give examples of countries with a high and countries with a low population density

E N D
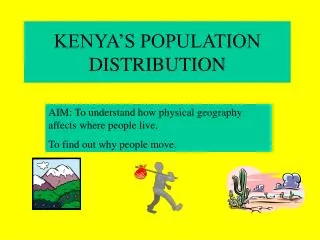
https://www.youtube.com/watch?v=dDk06h7Abbw Population Distribution http://www.worldometers.info/world-population/ Lesson starter;
We are learning to… • Give examples of countries with a high and countries with a low population density • Describe reasons for the distribution of the world’s population
I can… • Find out where densely and sparsely populated areas are from reading a dot map. • Write a report on the reason for differences in population density
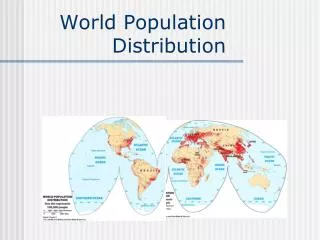
On the 31st of October 2011 the world population reached 7 billion – since then it has been increasing by 70 million a year
The land area covering the world is 150 million square kilometres (km²) • This means there are, on average, over 46 people per km²
Task One • Using a copy of the dot map provided along with an atlas: http://galen.metapath.org/popclk.html a) name 4 sparsely populated countries b) name 4 densely populated countries c) Using your iPad, look up the actual density of each of the countries you have chosen and put them into a table (use an atlas if you don’t have an iPad)
Links to relevant video/audio clips • https://www.youtube.com/watch?v=khFjdmp9sZk • Now watch the DVD on world population
Reasons for the world’s population distribution • Climate • Soil • Relief • Resources • Communications • Technological development • Economic activities
Climate • People prefer to live where there is rain throughout the year – no extremes • Few people live where the climate is hot and wet e.g. Amazon rainforest – this is unhealthy • Russia - cold
Soil • Some river valleys are crowded (densely populated) e.g. Ganges, Nile – the soil here is very fertile and so great for growing crops • The river also provides water all year round for crops
Relief • People prefer to live in flat, lowland areas – the Himalayas are sparsely populated due to the mountains – this makes building difficult, soils are thin and it is colder as you gain height
Resources • People tend to settle in places where there are plenty of resources available • Coal in north-east USA attracted people • Scenery is a natural resource – this attracts tourists e.g. California
Communications • People are attracted to areas where there are many roads, railways, airports and ports as these attract industry providing employment opportunities • Remote areas deter people e.g. Ontario Canada
Technological Development • Countries that have a high level of technology and well-educated people will be densely populated e.g Japan • Countries with natural resources also need the technology to be able to exploit their resources e.g. Democratic Republic of the Congo
Economic Activities • Areas with high industry or services will have greater population densities e.g. south-east Australia • Large numbers of people can be employed in a small area – unlike farming where a great deal of land is required
Task Two • Draw a table like the one below and classify the factors affecting population distribution according to human and physical factors Describe the effect of the following on population distribution: a) Climate b) Relief c) Natural Resources Continued on next slide
Task Two Go to page 154 of your Atlas Using the information there complete the following table: • Rank each of the countries from highest to lowest by: • Population • Size – area • Density
Task Three Using all of the information you have so far on population distribution write a report. You must include: • Examples of places that are densely populated, and reasons why. • Examples of places that are sparsely populated, and reasons why.
We were learning to… • Give examples of countries with a high and countries with a low population density • Describe reasons for the distribution of the world’s population
Can I… • Locate areas of sparsely and densely populated areas on a map • Write a report on the reasons for differences in population density