Download
1 / 11
110 likes | 118 Vues
Indraprastha Gas Limited: Check out the institutional research report of Q4 result of Indraprastha Gas Ltd. Indraprastha Gas (IGL’s) 4QFY18 revenue came in at Rs 12.33bn, up 23.1% YoY led by 11.3% YoY increase in volumes

E N D
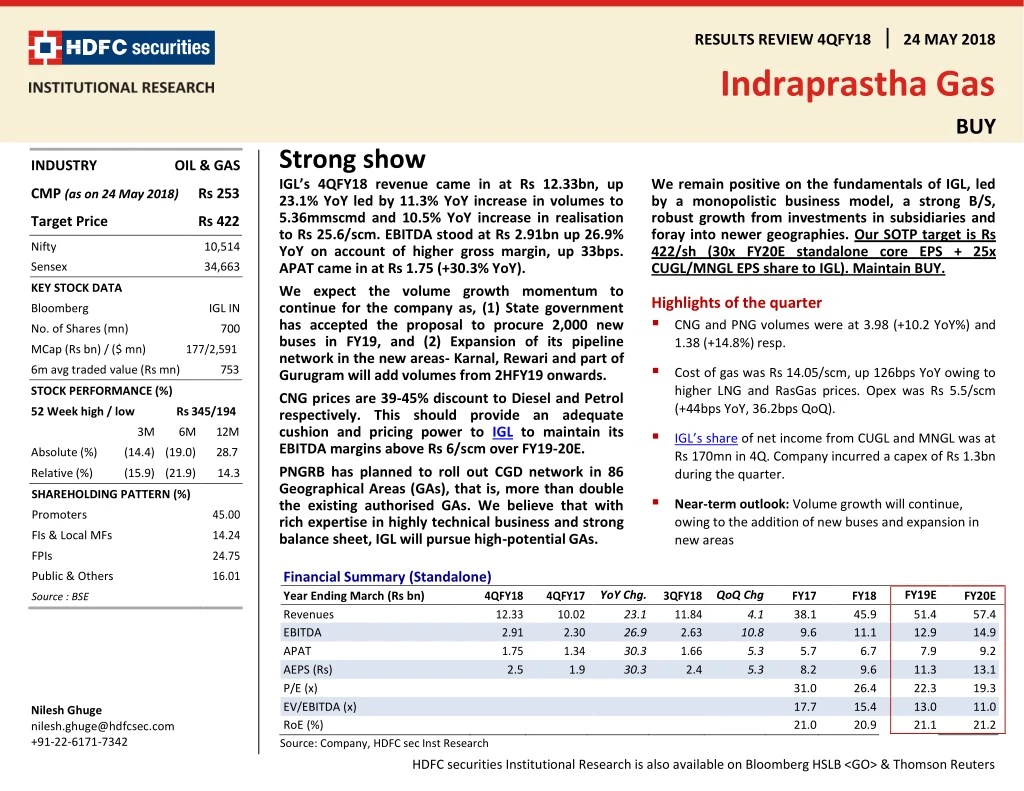
RESULTS REVIEW 4QFY18 Indraprastha Gas 24 MAY 2018 BUY Strong show IGL’s 4QFY18 revenue came in at Rs 12.33bn, up 23.1% YoY led by 11.3% YoY increase in volumes to 5.36mmscmd and 10.5% YoY increase in realisation to Rs 25.6/scm. EBITDA stood at Rs 2.91bn up 26.9% YoY on account of higher gross margin, up 33bps. APAT came in at Rs 1.75 (+30.3% YoY). We expect the volume growth momentum to continue for the company as, (1) State government has accepted the proposal to procure 2,000 new buses in FY19, and (2) Expansion of its pipeline network in the new areas- Karnal, Rewari and part of Gurugram will add volumes from 2HFY19 onwards. CNG prices are 39-45% discount to Diesel and Petrol respectively. This should provide an adequate cushion and pricing power to IGL to maintain its EBITDA margins above Rs 6/scm over FY19-20E. PNGRB has planned to roll out CGD network in 86 Geographical Areas (GAs), that is, more than double the existing authorised GAs. We believe that with rich expertise in highly technical business and strong balance sheet, IGL will pursue high-potential GAs. INDUSTRY OIL & GAS We remain positive on the fundamentals of IGL, led by a monopolistic business model, a strong B/S, robust growth from investments in subsidiaries and foray into newer geographies. Our SOTP target is Rs 422/sh (30x FY20E standalone core EPS + 25x CUGL/MNGL EPS share to IGL). Maintain BUY. CMP (as on 24 May 2018) Rs 253 Target Price Rs 422 Nifty 10,514 Sensex 34,663 KEY STOCK DATA Highlights of the quarter ▪CNG and PNG volumes were at 3.98 (+10.2 YoY%) and 1.38 (+14.8%) resp. ▪Cost of gas was Rs 14.05/scm, up 126bps YoY owing to higher LNG and RasGas prices. Opex was Rs 5.5/scm (+44bps YoY, 36.2bps QoQ). ▪IGL’s share of net income from CUGL and MNGL was at Rs 170mn in 4Q. Company incurred a capex of Rs 1.3bn during the quarter. ▪Near-term outlook: Volume growth will continue, owing to the addition of new buses and expansion in new areas Bloomberg IGL IN No. of Shares (mn) 700 MCap (Rs bn) / ($ mn) 177/2,591 6m avg traded value (Rs mn) 753 STOCK PERFORMANCE (%) 52 Week high / low Rs 345/194 3M 6M 12M Absolute (%) (14.4) (19.0) 28.7 Relative (%) SHAREHOLDING PATTERN (%) (15.9) (21.9) 14.3 Promoters 45.00 FIs & Local MFs 14.24 FPIs 24.75 Financial Summary (Standalone) Year Ending March (Rs bn) Revenues EBITDA APAT AEPS (Rs) P/E (x) EV/EBITDA (x) RoE (%) Public & Others 16.01 YoY Chg. 3QFY18QoQ Chg 11.84 2.63 1.66 2.4 FY19E 4QFY18 12.33 2.91 1.75 4QFY17 10.02 2.30 1.34 FY17 38.1 9.6 5.7 8.2 31.0 17.7 21.0 FY18 45.9 11.1 6.7 9.6 26.4 15.4 20.9 FY20E 57.4 14.9 9.2 13.1 19.3 11.0 21.2 Source : BSE 23.1 26.9 30.3 30.3 4.1 10.8 5.3 5.3 51.4 12.9 7.9 11.3 22.3 13.0 21.1 2.5 1.9 Nilesh Ghuge nilesh.ghuge@hdfcsec.com +91-22-6171-7342 Source: Company, HDFC sec Inst Research HDFC securities Institutional Research is also available on Bloomberg HSLB <GO> & Thomson Reuters
INDRAPRASTHA GAS: RESULTS REVIEW 4QFY18 Quarterly Financials Snapshot QoQ Chg YoY Chg. YoY Chg. 3QFY18 (Rs. mn) 4QFY18 4QFY17 FY18 FY17 (%) 23.1 22.3 44.8 18.6 26.9 10.7 (%) 20.4 19.6 15.6 30.5 15.5 8.5 (%) 4.1 0.6 0.9 7.3 10.8 3.8 Higher RM cost owing to higher APM price (+12.1% YoY) and RLNG prices (+9.7% YoY) Net Sales Raw material and Traded Goods Employee Expenses Other Operating Expenses EBITDA Depreciation 12.33 6.77 0.28 2.37 2.91 0.47 10.02 5.53 0.19 2.00 2.30 0.43 11.84 6.73 0.27 2.21 2.63 0.45 45.92 24.91 1.06 8.81 11.13 1.81 38.15 20.84 0.92 6.76 9.64 1.67 EBIT Other Income Interest PBT 2.44 0.27 0.01 2.70 1.87 0.21 0.00 2.07 30.6 28.0 32.6 30.3 2.18 0.33 0.00 2.50 12.2 (17.9) 69.4 8.2 9.32 1.02 0.02 10.32 7.97 0.65 0.01 8.61 17.0 56.6 39.7 20.0 Provision for tax RPAT APAT EPS (Rs) 0.96 1.75 1.75 2.50 0.73 1.34 1.34 1.92 30.4 30.3 30.3 30.3 0.84 1.66 1.66 2.37 14.0 5.3 5.3 5.3 3.62 6.71 6.71 9.58 2.90 5.71 5.71 8.16 24.9 17.5 17.5 17.5 Adjusted EPS (Rs) 2.50 1.92 30.3 2.37 5.3 9.58 8.16 17.5 Margin Analysis 4QFY18 54.9 4QFY17 YoY (bps) 55.2 1.9 3QFY18 QoQ (bps) 56.8 2.3 FY18 54.3 2.3 FY17 YoY (bps) 54.6 2.4 Raw material as % of Net Sales Employee Expenses as % of Net Sales Other Operating Expenses as % of Net Sales EBITDA Margin (%) Net Profit Margin (%) Tax Rate (%) Source: Company, HDFC sec Inst Research (33) 34 (191) (7) (37) (9) 2.2 19.2 19.9 (72) 18.6 57 19.2 17.7 148 23.6 14.2 35.4 22.9 13.4 35.4 72 79 1 22.2 14.0 33.6 141 16 179 24.2 14.6 35.0 25.3 15.0 33.6 (102) (36) 139 Page | 2
INDRAPRASTHA GAS: RESULTS REVIEW 4QFY18 Quarterly Operational Data YoY Chg. QoQ Chg YoY Chg. 4QFY18 4QFY17 3QFY18 FY18 FY17 (%) 12.8 11.3 17.7 (%) (0.4) (%) 11.3 10.2 14.8 Total Sales Volumes (mmscm) CNG PNG 482.0 358.0 124.0 433.0 325.0 108.0 484.0 358.0 126.0 3QFY18 1891 1412 479 1676 1269 407 On yearly basis, CNG volumes are robust, owing to conversion of Ola, Uber and private cars - (1.6) QoQ Chg YoY Chg. YoY Chg. FY18 FY17 4QFY18 4QFY17 (%) 11.3 10.2 14.8 (%) 12.8 11.3 17.7 (%) 1.8 2.2 0.6 Total Volume (mmscmd) CNG PNG Margins (Rs/scm) Realisation Gross Spread Opex EBITDA Spreads PAT Source: Company, HDFC sec Inst Research 5.36 3.98 1.38 4.81 3.61 1.20 5.3 3.9 1.4 5.18 3.87 1.31 FY18 24.3 11.1 5.2 5.9 3.5 4.59 3.48 1.12 FY17 YoY (bps) 22.8 10.3 4.6 5.8 3.4 4QFY18 25.6 11.5 4QFY17 YoY (bps) 23.1 10.4 5.1 5.3 3.1 3QFY18 QoQ (bps) 24.5 10.6 5.1 5.4 3.4 244.1 117.8 43.5 74.3 52.9 111.9 97.2 36.2 61.0 19.7 152.3 78.0 64.3 13.7 14.0 5.5 6.0 3.6 Page | 3
INDRAPRASTHA GAS: RESULTS REVIEW 4QFY18 Volume Trend Margin Trend Gross margin EBITDA margin PAT margin CNG PNG Total YoY growth Rs/scm mmscmd 4.3 4.5 4.6 4.8 Volume growth is visible owing to rising concerns over non- CNG vehicles % 14.0 5.2 5.3 5.4 20.0 18.0 16.0 14.0 12.0 10.0 8.0 6.0 4.0 2.0 - (2.0) 6.0 12.0 4.9 5.0 4.1 10.0 4.1 4.0 3.8 3.8 4.0 8.0 3.0 6.0 2.0 4.0 1.0 2.0 - - 4QFY15 1QFY16 2QFY16 3QFY16 4QFY16 1QFY17 2QFY17 3QFY17 4QFY17 1QFY18 2QFY18 3QFY18 4QFY18 4QFY15 1QFY16 2QFY16 3QFY16 4QFY16 1QFY17 2QFY17 3QFY17 4QFY17 1QFY18 2QFY18 3QFY18 4QFY18 Source: Company, HDFC sec Inst Research Source: Company, HDFC sec Inst Research Assumptions Assumptions Total Volumes (mmscmd) CNG (mmscmd) PNG (mmscmd) Total Volumes YoY growth (%) CNG YoY Growth (%) PNG YoY Growth (%) Gross margin (Rs/scm) EBITDA margin (Rs/scm) PAT (Rs/scm) Exchange Rate (Rs/USD) Source: Company, HDFC sec Inst Research FY15 3.8 2.9 0.9 1.3 4.0 (6.6) 9.2 5.6 3.1 60.4 FY16 4.0 3.1 0.9 3.8 4.5 1.7 9.6 5.3 2.9 61.1 FY17 4.6 3.5 1.1 15.0 13.5 20.0 10.3 5.8 3.4 65.5 FY18 5.2 3.9 1.3 12.8 11.3 17.7 11.1 5.9 3.5 67.1 FY19E 5.7 4.2 1.5 10.4 9.9 12.0 11.3 6.2 3.8 67.0 FY20E 6.3 4.6 1.7 10.0 8.6 14.0 11.5 6.5 4.0 67.0 Higher indirect taxes on Diesel and Petrol and Guaranteed supply of domestic gas for CNG and Domestic PNG should provide an adequate cushion and pricing power for IGL to maintain its margins above Rs6/scm Page | 4
INDRAPRASTHA GAS: RESULTS REVIEW 4QFY18 CNG Volumes Growth PNG Volumes Growth 0.9 CNG YoY Gr (%) - RHS CNG PNG PNG YoY Gr (%) - RHS mmscmd 1.8 mmscmd % % CNG volumes to grow by ~9% CAGR over FY19-20E 25.0 5.0 4.5 4.0 3.5 3.0 2.5 2.0 1.5 1.0 0.5 - 16.0 1.6 13.5 14.0 20.0 17.7 11.3 20.0 1.4 12.0 1.2 10.0 9.9 14.0 15.0 1.0 8.6 8.0 12.0 1.7 PNG volumes to grow by ~13% CAGR over FY19E-20E as new areas have high PNG potential 4.6 0.8 4.2 1.5 10.0 3.9 6.0 1.3 4.5 3.5 0.6 1.1 3.1 4.0 0.4 5.0 1.7 2.0 0.2 - - - FY17 FY18E FY19E FY20E FY18E FY19E FY16 FY17 FY20E FY16 Source: Company, HDFC sec Inst Research Source: Company, HDFC sec Inst Research Total Volume Growth EBITDA Margin Trend Rs/scm CNG PNG Overall YoY Gr (%) - RHS Overall volumes to grow by ~10% CAGR over FY19-20E mmscmd 7.0 7.0 % 18.0 16.0 6.0 15.0 6.0 12.8 14.0 1.7 5.0 5.0 1.5 12.0 1.3 4.0 10.4 4.0 1.1 .0 10.0 8.0 10 6.5 0.9 6.2 3.0 Pricing power to keep EBITDA margin above Rs 6/scm 5.9 5.9 3.0 5.3 6.0 4.6 2.0 3.8 4.2 2.0 3.9 3.5 4.0 3.1 1.0 1.0 2.0 - - - FY16 FY17 FY18E FY19E FY20E FY16 FY17 FY18E FY19E FY20E Source: Company, HDFC sec Inst Research Page | 5
INDRAPRASTHA GAS: RESULTS REVIEW 4QFY18 SOTP Valuation EPS (Rs/sh) Multiple (x) Value Rs/sh Valuation Basis Standalone business (excluding Dividend income) MNGL CUGL Value per share Source: HDFC sec Inst Research 12.7 1.2 0.5 30.0 25.0 25.0 381 29 11 422 P/E multiple on FY20E P/E multiple on FY20E P/E multiple on FY20E Peer Valuations EPS (Rs/sh) P/E (x) P/BV (x) ROE (%) MCap (Rs bn) CMP (Rs) TP (Rs) Upside % RECO FY17E FY18E FY19E FY20E FY17 FY18E FY19E FY20E FY17 FY18E FY19E FY20E FY17 FY18E FY19E FY20E Reliance Industries ONGC Indian Oil Corp BPCL HPCL Petronet LNG Oil India Indraprastha Gas Mahanagar Gas Asian Oil Field Services Source: Company, HDFC sec Inst Research 5,892.7 929 BUY 1,181 27 49.5 62.9 74.8 81.3 12.2 9.2 8.1 7.5 2.0 1.8 1.6 1.5 11.6 13.1 13.9 13.4 2,374.2 185 BUY 290 57 13.9 16.1 22.1 23.2 11.7 10.1 7.4 7.0 1.3 1.2 1.1 1.1 10.2 10.9 14.0 13.8 1,459.9 154 BUY 224 46 20.2 22.5 23.5 24.6 6.5 5.9 5.6 5.3 1.5 1.3 1.2 1.1 20.3 20.3 19.1 18.0 786.8 469.9 394 308 BUY BUY 584 458 48 49 40.2 40.6 35.1 36.3 42.0 30.4 45.5 29.3 5.9 4.9 6.8 5.5 5.7 6.5 5.3 6.7 2.7 2.3 2.3 2.1 2.0 1.9 1.7 28.2 1.7 32.3 21.9 25.9 22.7 19.4 21.3 16.7 316.5 211 BUY 302 43 11.4 13.9 13.5 16.8 20.8 18.3 17.4 14.0 3.9 3.3 2.9 2.5 23.2 23.3 19.6 21.4 269.0 237 BUY 333 40 23.8 22.9 29.1 30.8 5.5 5.7 4.5 4.2 0.9 0.9 0.8 0.7 10.5 8.5 9.9 9.5 177.0 253 BUY 422 42 8.2 9.9 11.7 13.1 31.3 25.8 21.9 19.5 6.3 5.4 4.7 4.1 20.4 22.0 22.4 21.7 78.0 790 BUY 1,259 59 39.8 48.4 45.1 46.6 23.7 19.2 20.9 20.2 4.2 3.7 3.4 3.1 22.1 24.3 20.2 18.9 4.9 130 NA 166 28 1.5 13.0 12.3 16.6 132.3 8.9 5.3 7.6 10.6 2.8 2.3 1.8 17.3 44.8 22.3 23.9 Page | 6
INDRAPRASTHA GAS: RESULTS REVIEW 4QFY18 Standalone Income Statement Rs bn Revenues Growth % Raw Material Employee Cost Other Expenses EBITDA EBIDTA Margin (%) EBITDA Growth % Depreciation EBIT Other Income (Including EO Items) Interest PBT Tax RPAT APAT APAT Growth (%) AEPS AEPS Growth % Source: Company, HDFC sec Inst Research Standalone Balance Sheet (Rs bn) SOURCES OF FUNDS Share Capital Reserves And Surplus Total Equity Long-term Debt Short-term Debt Total Debt Deferred Tax Liability Long-term Provision TOTAL SOURCES OF FUNDS APPLICATION OF FUNDS Net Block Capital WIP LT Loans And Advances Total Non-current Investments Inventories Debtors Cash and Cash Equivalents Other Current Assets Total Current Assets Creditors Other Current Liabilities & Provns Total Current Liabilities Net Current Assets TOTAL APPLICATION OF FUNDS Source: Company, HDFC sec Inst Research FY20E 57.37 11.6 30.97 1.26 10.28 14.86 25.9 15.0 2.00 12.86 1.15 FY16 36.74 0.1 22.76 0.78 5.57 7.63 20.8 4.9 1.56 6.06 0.30 0.10 6.36 2.19 4.17 4.17 3.8 6.0 9.5 FY17 38.15 3.8 20.84 0.92 6.76 9.64 25.3 26.4 1.67 7.97 0.65 0.01 8.62 2.90 5.72 5.72 37.3 8.2 36.3 FY18 45.92 20.4 24.91 1.06 8.81 11.13 24.2 15.5 1.81 9.32 1.02 0.02 10.34 3.62 6.72 6.72 17.5 9.6 17.5 FY19E 51.40 11.9 27.81 1.15 9.52 12.93 25.1 16.1 1.90 11.02 1.12 0.02 12.15 4.20 7.94 7.94 18.1 11.3 18.1 FY16 FY17 FY18P FY19E FY20E 1.40 23.76 25.16 1.40 27.87 29.27 1.40 33.73 35.13 1.40 38.88 40.28 1.40 44.82 46.22 - - - - - - - - - - - - - - - 1.65 0.15 26.96 1.81 0.20 31.28 2.25 0.14 37.52 2.25 0.15 42.68 2.25 0.17 48.64 - 20.19 2.67 0.06 2.59 0.58 2.51 4.54 0.67 8.30 1.61 5.24 6.85 1.44 26.96 21.17 3.52 0.08 2.59 0.52 2.01 10.26 0.70 13.50 2.74 6.85 9.59 3.91 31.28 24.32 3.86 0.09 2.58 0.52 2.26 14.48 1.17 18.43 3.39 8.38 11.76 6.67 37.52 26.38 4.32 0.09 2.58 0.59 2.53 17.57 1.23 21.92 3.78 8.82 12.60 9.32 42.68 28.12 4.32 0.09 2.58 0.65 2.83 22.26 1.30 27.04 4.21 9.29 13.50 13.54 48.64 14.01 4.85 9.16 9.16 15.3 13.1 15.6 Page | 7
INDRAPRASTHA GAS: RESULTS REVIEW 4QFY18 Standalone Cash Flow Rs bn Reported PBT Non-operating & EO Items Interest Expenses Depreciation Working Capital Change Tax Paid OPERATING CASH FLOW ( a ) Capex Free Cash Flow (FCF) Investments Non-operating Income Others INVESTING CASH FLOW ( b ) Debt Issuance/(Repaid) Interest Expenses FCFE Share Capital Issuance Dividend FINANCING CASH FLOW ( c ) NET CASH FLOW (a+b+c) Closing Cash & Equivalents Source: Company, HDFC sec Inst Research Standalone Key Ratios FY16 FY17 FY18E FY19E FY20E FY16 6.38 (0.30) 0.10 1.56 0.78 (1.81) 6.71 (2.54) 4.17 0.32 0.30 FY17 8.61 (0.65) 0.01 1.67 3.32 (2.74) 10.22 (3.50) 6.72 FY18E 10.32 (1.02) 0.02 1.81 1.42 (3.17) 9.38 (5.30) 4.08 FY19E 12.13 (1.12) 0.02 1.90 0.46 (4.20) 9.19 (4.42) 4.76 FY20E 14.01 (1.15) PROFITABILITY % EBITDA Margin EBIT Margin 20.8 16.5 25.3 20.9 24.2 20.3 25.1 21.4 25.9 22.4 - APAT Margin RoE Core RoCE RoCE EFFICIENCY Tax Rate % Fixed Asset Turnover (x) Inventory (days) Debtors (days) Other Current Assets (days) Payables (days) Other Current Liab & Provns (days) Cash Conversion Cycle (days) Net Debt/EBITDA (x) Net D/E Interest Coverage PER SHARE DATA (Rs) EPS CEPS Dividend Book Value VALUATION P/E (x) P/Cash EPS (x) P/BV (x) EV/EBITDA (x) EV/Revenue (x) Dividend Yield (%) OCF/EV (%) FCFF/EV (%) FCFE/M Cap (%) Source: Company, HDFC sec Inst Research 11.3 17.7 17.0 16.4 15.0 21.0 20.1 19.6 14.6 20.9 18.4 19.5 15.5 21.1 18.7 19.8 16.0 21.2 20.6 20.1 2.00 0.49 (4.85) 10.50 (3.74) 6.76 34.4 1.1 33.6 1.0 35.0 1.0 34.7 1.0 34.6 1.0 6 5 4 4 4 - - 25 7 16 52 (31) (0.6) (0.2) 19 7 26 66 (61) (1.1) (0.4) 18 9 27 67 (62) (1.3) (0.4) 18 9 27 63 (59) (1.4) (0.4) 18 8 27 59 (56) (1.5) (0.5) 0.65 1.02 1.12 1.15 - - - - - (1.92) (1.45) (0.10) 2.62 (2.85) (4.28) (3.30) (2.60) - - - - - (0.01) 6.71 (0.02) 4.07 (0.02) 4.75 6.76 - - - - - - - - - - (0.82) (2.37) 2.42 4.53 (1.16) (1.17) 6.20 10.29 (2.35) (2.36) 2.74 14.51 (2.77) (2.79) 3.10 17.57 (3.20) (3.20) 4.71 22.26 6.0 8.2 1.0 35.9 8.2 10.5 1.4 41.8 9.6 12.2 2.9 50.2 11.3 14.0 3.4 57.5 13.1 15.9 3.9 66.0 42.3 30.8 7.0 22.6 4.7 0.4 3.9 2.4 1.5 31.0 24.0 6.1 17.3 4.4 0.6 6.1 4.0 3.8 26.4 20.8 5.0 14.6 3.5 1.1 5.8 2.5 2.3 22.3 18.0 4.4 12.3 3.1 1.3 5.8 3.0 2.7 19.3 15.9 3.8 10.4 2.7 1.5 6.8 4.4 3.8 Page | 8
INDRAPRASTHA GAS: RESULTS REVIEW 4QFY18 RECOMMENDATION HISTORY Date CMP 205 329 329 292 297 253 Reco BUY BUY BUY BUY BUY BUY Target 252 421 421 421 422 422 IGL TP 29-May-17 28-Dec-17 11-Jan-18 7-Feb-18 12-Apr-18 24-May-18 450 400 350 300 250 200 150 Rating Definitions BUY : Where the stock is expected to deliver more than 10% returns over the next 12 month period Mar-18 Feb-18 Apr-18 May-18 Jun-17 Jul-17 Jan-18 May-17 Sep-17 Nov-17 Aug-17 Oct-17 Dec-17 NEUTRAL : Where the stock is expected to deliver (-)10% to 10% returns over the next 12 month period SELL : Where the stock is expected to deliver less than (-)10% returns over the next 12 month period Page | 9
INDRAPRASTHA GAS: RESULTS REVIEW 4QFY18 Disclosure: I, Nileh Ghuge, MMS, author and the name subscribed to this report, hereby certify that all of the views expressed in this research report accurately reflect our views about the subject issuer(s) or securities. HSL has no material adverse disciplinary history as on the date of publication of this report. We also certify that no part of our compensation was, is, or will be directly or indirectly related to the specific recommendation(s) or view(s) in this report. Research Analyst or his/her relative or HDFC Securities Ltd. does not have any financial interest in the subject company. Also Research Analyst or his relative or HDFC Securities Ltd. or its Associate may have beneficial ownership of 1% or more in the subject company at the end of the month immediately preceding the date of publication of the Research Report. Further Research Analyst or his relative or HDFC Securities Ltd. or its associate does not have any material conflict of interest. Any holding in stock –No HDFC Securities Limited (HSL) is a SEBI Registered Research Analyst having registration no. INH000002475. Disclaimer: This report has been prepared by HDFC Securities Ltd and is meant for sole use by the recipient and not for circulation. The information and opinions contained herein have been compiled or arrived at, based upon information obtained in good faith from sources believed to be reliable. Such information has not been independently verified and no guaranty, representation of warranty, express or implied, is made as to its accuracy, completeness or correctness. All such information and opinions are subject to change without notice. This document is for information purposes only. Descriptions of any company or companies or their securities mentioned herein are not intended to be complete and this document is not, and should not be construed as an offer or solicitation of an offer, to buy or sell any securities or other financial instruments. This report is not directed to, or intended for display, downloading, printing, reproducing or for distribution to or use by, any person or entity who is a citizen or resident or located in any locality, state, country or other jurisdiction where such distribution, publication, reproduction, availability or use would be contrary to law or regulation or what would subject HSL or its affiliates to any registration or licensing requirement within such jurisdiction. If this report is inadvertently send or has reached any individual in such country, especially, USA, the same may be ignored and brought to the attention of the sender. This document may not be reproduced, distributed or published for any purposes without prior written approval of HSL. Foreign currencies denominated securities, wherever mentioned, are subject to exchange rate fluctuations, which could have an adverse effect on their value or price, or the income derived from them. In addition, investors in securities such as ADRs, the values of which are influenced by foreign currencies effectively assume currency risk. It should not be considered to be taken as an offer to sell or a solicitation to buy any security. HSL may from time to time solicit from, or perform broking, or other services for, any company mentioned in this mail and/or its attachments. HSL and its affiliated company(ies), their directors and employees may; (a) from time to time, have a long or short position in, and buy or sell the securities of the company(ies) mentioned herein or (b) be engaged in any other transaction involving such securities and earn brokerage or other compensation or act as a market maker in the financial instruments of the company(ies) discussed herein or act as an advisor or lender/borrower to such company(ies) or may have any other potential conflict of interests with respect to any recommendation and other related information and opinions. HSL, its directors, analysts or employees do not take any responsibility, financial or otherwise, of the losses or the damages sustained due to the investments made or any action taken on basis of this report, including but not restricted to, fluctuation in the prices of shares and bonds, changes in the currency rates, diminution in the NAVs, reduction in the dividend or income, etc. HSL and other group companies, its directors, associates, employees may have various positions in any of the stocks, securities and financial instruments dealt in the report, or may make sell or purchase or other deals in these securities from time to time or may deal in other securities of the companies / organizations described in this report. HSL or its associates might have managed or co-managed public offering of securities for the subject company or might have been mandated by the subject company for any other assignment in the past twelve months. HSL or its associates might have received any compensation from the companies mentioned in the report during the period preceding twelve months from t date of this report for services in respect of managing or co-managing public offerings, corporate finance, investment banking or merchant banking, brokerage services or other advisory service in a merger or specific transaction in the normal course of business. HSL or its analysts did not receive any compensation or other benefits from the companies mentioned in the report or third party in connection with preparation of the research report. Accordingly, neither HSL nor Research Analysts have any material conflict of interest at the time of publication of this report. Compensation of our Research Analysts is not based on any specific merchant banking, investment banking or brokerage service transactions. HSL may have issued other reports that are inconsistent with and reach different conclusion from the information presented in this report. Research entity has not been engaged in market making activity for the subject company. Research analyst has not served as an officer, director or employee of the subject company. We have not received any compensation/benefits from the subject company or third party in connection with the Research Report. HDFC securities Limited, I Think Techno Campus, Building - B, "Alpha", Office Floor 8, Near Kanjurmarg Station, Opp. Crompton Greaves, Kanjurmarg (East), Mumbai 400 042 Phone: (022) 3075 3400 Fax: (022) 2496 5066 Compliance Officer: Binkle R. Oza Email: complianceofficer@hdfcsec.com Phone: (022) 3045 3600 HDFC Securities Limited, SEBI Reg. No.: NSE-INB/F/E 231109431, BSE-INB/F 011109437, AMFI Reg. No. ARN: 13549, PFRDA Reg. No. POP: 04102015, IRDA Corporate Agent License No.: HDF 2806925/HDF C000222657, SEBI Research Analyst Reg. No.: INH000002475, CIN - U67120MH2000PLC152193 Mutual Funds Investments are subject to market risk. Please read the offer and scheme related documents carefully before investing. Page | 10
INDRAPRASTHA GAS: RESULTS REVIEW 4QFY18 HDFC securities Institutional Equities Unit No. 1602, 16th Floor, Tower A, Peninsula Business Park, Senapati Bapat Marg, Lower Parel, Mumbai - 400 013 Board: +91-22-6171 7330 www.hdfcsec.com Page | 11