Download
1 / 56
560 likes | 654 Vues
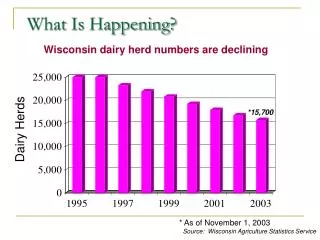
What happened to computing 1930-80 is now happening to biology. Friden mechanical calculator: 1930-1966. Sharp single chip calculator: 1977. Friden electronic calculator: 1965. Intel 4004 m proc: 1971.

E N D
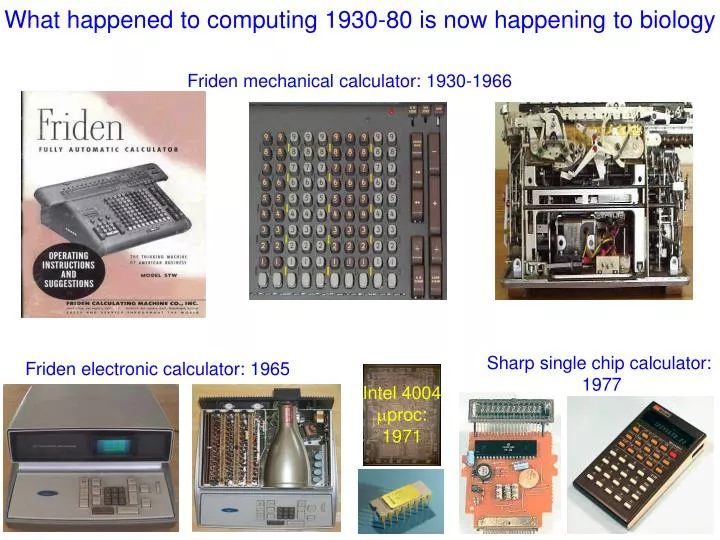
What happened to computing 1930-80 is now happening to biology Friden mechanical calculator: 1930-1966 Sharp single chip calculator: 1977 Friden electronic calculator: 1965 Intel 4004 mproc: 1971
What happened to computing 1930-80 is now happening to biology- Example: electroporation Proportion of cells transfected Pre-2000 % cells damaged by transfection The complete protocol Today Tomorrow
The geek shall inherit (systems) biology Pathway/ interaction DBs / literature cell-specific, comprehensive, kinetic and quantitative data data analysis experiments to test hypotheses model construction Computation Biology experimental planning model analysis Technology hypothesis formulation
Discovery science via high throughput ‘omic technologies Screening - multi-target/multi-component drugs - multi-parameter disease signatures Observation & data-driven Focus on nonlinear interactions Study irreducible systems Analyzing emergent (difficult-to-predict, nonlinear) properties Hypothesis and model-driven 2 complementary approaches in systems biology: Top-down, global, systematic Bottom-up, local dynamics global climate local weather
The yeast galactose utilization pathway – bottom up view Galactose Gal2p (transporter) + feedback Gal3p + feedback Gal1p (kinase) Galactose Galactose 1-phosphate Gal3p* UDP-galactose - feedback Gal7p (transferase) Gal10p (epimerase) Gal80p Gal4p UDP- glucose Gal80 Glucose 1-phosphate Gal4p GSC2 FKS1 FKS3 Gal3 UGP1 TPS1 TSL1 TPS3 Gal4p PGM1 PGM2 GSY1 GSY2 GPH1 Gal2 1,3-â-Glucan Gal4p Threhalose synthesis Gal 1,7,10 Glucose 6-phosphate Glycogen synthesis de Atauri et al Biochem J. 2005
• in1 • in2 out 1 4 3 2 1 Vdd T1 T5 T11 . 2 • 7 • T6 in1 T9 4 T2 T12 • • 6 • • 3 8 • • out = XOR T3 T7 T13 T10 • • in2 5 T4 T8 T14 Gnd 0 NOR (1) NAND (2) NOT (3) NOR (4) An Exclusive OR gate out = XOR
Phagocytosis Fas Cell adhesion Translation Actin polymerization mRNA stability p38 pathway “Guilt by association” network analysis Transfac/HPRD/in-house documented P-P interaction Red nodes: down-regulated Green nodes: up-regulated Transfac documented P-DNA interaction
Network motifs & functional building blocks Ecoli sea urchin functional building blocks Regulated &/or rapid response Nonlinear switch Unidirectional switch Bolouri & Davidson BioEssays 2002 Community effect yeast Rick Young & colleagues Uri Alon & colleagues
Cannot guess function from topology alone Network topology: 1 T1 T5 T11 2 • 7 • T6 in1 . T9 • T2 T12 • • • • • • T3 T13 T10 • • in2 5 T4 T8 T14 0 equivalent network motifs/modules Possible (mis)interpretation: B A if (select1=on & select2=on) • T11 T12 7 • A T13 select1 select2
A topological motif may implement different functions The feed forward motif: Alon & colleagues, Nature Genetics, 2002. 31(1): p. 64-8 see also:
Potential genetic regulatory functional building blocks (D) (A) (E) (F) (B) (C) (g)
GCM Otx GataE mRNA mRNAss 2 cooperative sites 1st order Pss P At steady state: PSS = (ks/kdp).mRNA mRNASS= (kt/kdm).Y Kdiss kt.ks/2.kdm.kdp
Potential genetic regulatory functional building blocks (D) (A) (E) (F) (B) (C) (g)
blue gene activity level _ cell 1 _ cell 2 _ cell 3 (1) (2) (3) cell 1 driver gene positive driver positive intercellular feedback cell type specific gene battery Simulated time cb c GSK-3 frizzled Krox Nb-TCF Wnt8 b-catenin/Wnt8 ‘Community Effect’ filters out expression variability Cells in a reinforcing loop - all cells in group adopt same fate - sharp boundary between cell types - insensitive to level of “driver”
Intercellular positive feedback: The community effect Gurdon ‘88, Nature, 336, 772-4
Potential genetic regulatory functional building blocks (D) (A) (E) (F) (B) (C) (g)
Intracellular negative feedback x (A) tuned for regulated level See also Ashburner et al 1973-1981 (see Cell, 1990. 61(1):1-3) (B) single transcriptional pulse (C) tuned for rapid response
FoxA (D) tuned for long lasting oscillation
Potential genetic regulatory functional building blocks (D) (A) (E) (F) (B) (C) (g)
Cell 2 (anterior) Cell 1 (posterior) Wnt Smo::Cos2 Su(Fu) Fu Ci::Su(Fu) Smo CiA CiR Cos2::GSK3b Ptc Smo_I TCF Nkd Dlp u TCF Wnt pathway En Ptc: :Hh Slp Hh pathway Hh Ci
Mutual exclusion in a mammalian adult cell specification process
gene 1 gene 2 Mutual exclusion operator cooperativity factor = 2 cooperativity factor = 3 cooperativity factor = 4 after Cherry & Adler, JTB 2000
Potential genetic regulatory functional building blocks (D) (A) (E) (F) (B) (C) (g)
The feed forward motif: Alon & colleagues, Nature Genetics, 2002. 31(1): p. 64-8 see also:
100 molecules yeast ~ 2 days MF
Potential genetic regulatory functional building blocks (D) (A) (E) (F) (B) (C) (g)
gene2 gene2 gene1 gene1 Direct activation Repression cascade steady state gene 2 steady state gene 2 activator level activator level Regulatory circuit elements: boundary detection switches U activator activator gene3 U cell type 2 gene1 gene1 cell type 1 gene2 gene2 gene2, cell2 gene2, cell1 time time time
Potential genetic regulatory functional building blocks (D) (A) (E) (F) (B) (C) (g)
Potential genetic regulatory functional building blocks (D) (A) (E) (F) (B) (C) (g)
TLR4 NFkB ATF3 IL6, IL12b… A feedforward motif functioning as a reset (homeostasis) mechanism NFkB ATF3 NFkB ATF3 TLR4 genes Gilchrist et al, Nature, 2006
P2 P2 quantitative measure of behavior P1 P1 • Concave: • Poor stability margins • Parameter interdependence • Convex: • Large stability margins • Parameter independence Robust behavior in parameter space Note also rate of change of ‘desired’ behavior away from operating point
The same genes take part in different processes and functional blocks Different genes implement the same functional building blocks Data from Davidson lab