Download
1 / 20
200 likes | 289 Vues
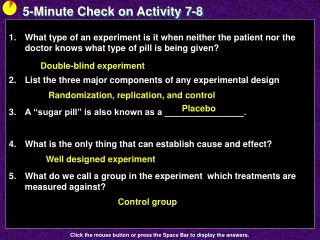
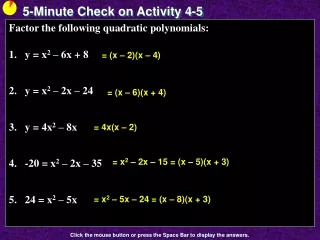
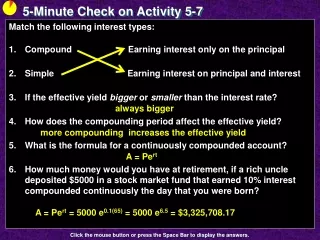
5-Minute Check on Activity 7-4. Given the following data: 8, 1, 9, 2, 3, 4, 4, 5, 5, 6, 7, 8, 8 Find the mean Find the median Find the mid-range Find the mode What are the four descriptors of a distribution? What are the three types of shape? Which measures of center are resistant?.

E N D
5-Minute Check on Activity 7-4 • Given the following data: 8, 1, 9, 2, 3, 4, 4, 5, 5, 6, 7, 8, 8 • Find the mean • Find the median • Find the mid-range • Find the mode • What are the four descriptors of a distribution? • What are the three types of shape? • Which measures of center are resistant? Sum=70 70 / 13 = 5.38 Middle value of 13 is the 7th: 5 (min+max)/2 = (1 + 9) / 2 = 5 8 occurs the most often Shape, Outliers, Center, Spread Skewed left, symmetric, skewed right A B C D Mode Mean Median Mid-range B D Click the mouse button or press the Space Bar to display the answers.
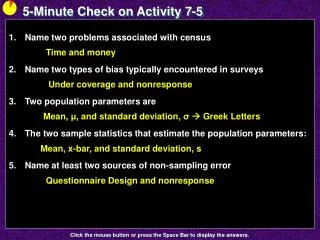
Activity 7 - 5 Sampling a Population
Objectives • Know the difference between a census and a sample • Identify the characteristics of a simple random sample • Know what bias in a sample means • Be able to select a simple random sample, when possible • Identify how the size of a sample affects the result
Vocabulary • Census – when every individual in a population is measured • Sample – is a subset of the population (not the whole) • Sampling – the process of collecting data from some fraction of the population • Bias – simply means that some individuals are somehow favored over others in the population • Simple Random Sample (SRS) – the result of a sampling method that assures every possible sample of the same size has an equal probability of being selected
Activity Suppose you have a need to know the average weight of adults in the United States, or the mean age of blue crabs in the Chesapeake Bay, or the median household income in the Commonwealth of Virginia. To determine such measures of central tendency, it is not usually practical to obtain the data for every individual in the population. Why is it not possible to conduct a census on the populations described above? US adults - costly as the census is done only every 10 years and still misses people Blue crabs - we would have to empty the Bay to get them all Household income - similar to the census; plus people don’t tell you the truth always about how much money they make
Activity cont Since a sample can be of any size, how would you compare the practicality and usefulness of samples of size 1, 25, 2000, and 2 million when attempting to estimate the mean household income in Virginia. Size n=1 easy to do, but what does it really show? Size n=25 still easy to do, and it shows more data so it would be more significant Size n=1 harder to do, but the results would be even more significant Size n=1 very hard to do – nearing census like, but the results be have the strongest significance
Census versus a Sample • Census • every member of a population is measured • expensive to do (and time consuming) • US census is done once every 10 years • Sample • subset of the population is measured • inferences about the entire population are made from the measurements gathered in the sample • telephone polls usually sample about 1000 people
A Few Thoughts on Sampling Larger samples are better and more accurate, but there are always trade-offs in time and money. Exact samples needed to get a certain accuracy can be determined by a mathematical formula (beyond our course). These numbers are most often seen in surveys reported in the media (with accuracy listed as percentage points).
Four Sources of Data • Observational Studies • Census • Existing sources • Previous study’s data • Data collections from other activities • Survey sampling • Designed experiments
Simple Random Sampling (SRS) • Simple random sampling (SRS) • Most important sampling technique we study • Many of the inference techniques have it as a requirement • Often times it is assumed or given in the problem • All possible samples of a given size must be equally likely
SRS and Random # Table • In order to have students get the same results in a SRS, questions ask students to use a random number table
Bias • Bias – nonsampling error introduced by giving preference to selecting some individuals over others, by giving preference to some answers by wording the questions a particular way, etc • Key is systematically favoring something (not being a random selection)
Sources of Bias • Undercoverage results from an incomplete frame on the surveyor’s part • Nonresponse can be from either the surveyor (can’t find the person) or the person’s unwillingness to answer • Response bias (lies) can result from either the respondent or the influence of the interviewer
Errors in Sampling Sampling Error Non sampling Error • Designer • Incomplete Frame • Questionnaire Design • Poorly worded questions • Inflammatory words • Question order • Response order sample gives incomplete information about the population Subject Nonresponse Misrepresented answers Sampling Process Iceberg Interviewer errors Collection Execution Data-entry (input) errors AnalysisProcess
Sources of Nonsampling Error • Incomplete Frame • Nonresponse • Questionnaire Design • Poorly worded questions • Inflammatory words • Question order • Response order • Data Collection • Interviewer error • Misrepresented answers • Data-entry (input) errors
Sampling Example The table below shows the current grades for all 20 students in Mr. Horton’s economics class.
Setting Things Up • Enter the desired seed, 15 • Press STO. An arrow appears in the display • Press MATH, highlight PRB, select rand (item #1) • Press ENTER. The seed is now set Use randint(lower bound, upper bound, # needed)
Sampling Example cont Mean = 79 and Median = 79.5 (??) • Compute the mean and median for the class • What do these values represent? • Use your calculator to generate 10 random numbers • Use the first 3 distinct (non repeating) as an SRS of Mr Horton’s class and calculate the mean and median • Repeat steps b and c with a sample size of 5 Population values; for mean, 4, 17, 8, 1, 7, 6, 5, 7, 19, 20 95, 62, 65 mean = 74 median = 65 18, 5, 16, 4, 1, 10, 20, 18, 2, 9 88, 71, 79, 95, 78 mean = 82.2 median = 79
Sampling Example cont • Repeat steps b and c with a sample size of 10 (note: you probably will have to generate 15 random numbers) • What do you do if you get too many repeated numbers? • What do we notice as sample size increases? • Why did we all get the same “random” numbers? 11, 11, 15, 3, 10, 2, 1, 17, 1, 10, 17, 15, 18, 10, 20 3, 19, 13, …. 67, 81, 82, 78, 84, 78, 62, 88, 63, 93 mean = 77.6 median = 79.5 just get some more and keep eliminating numbers already chosen The sample values should approach the population values We started off with the same seed value and the calculator produces pseudorandom numbers (see www.random.org)
Summary and Homework • Summary • Census measures every individual in a population • Sample is a fraction of the population • Sampling is the process of collecting a sample from the population • Bias occurs when some individuals have a better chance of being selected than other • Simple Random Sample (SRS) is the best type of sample • Populations have parameters (, ) • Samples have statistics (x-bar and s) that estimate parameters • Homework • pg 834 – 837; problems 1, 2, 5, 6