Download
1 / 5
50 likes | 172 Vues
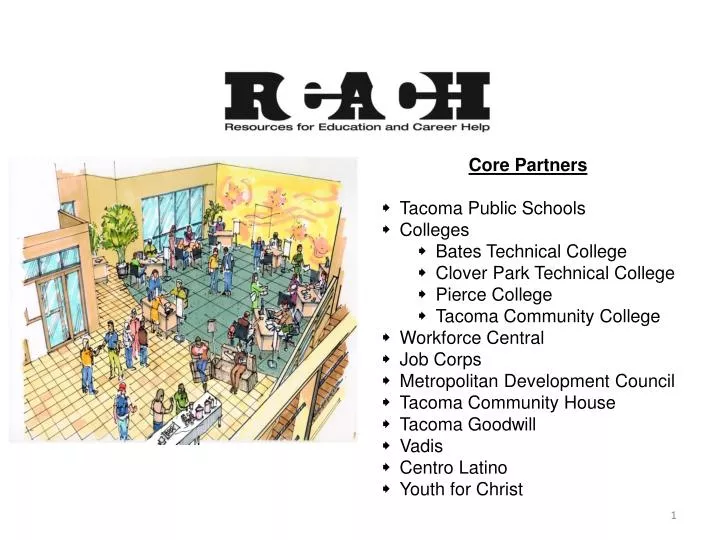
Core Partners Tacoma Public Schools Colleges Bates Technical College Clover Park Technical College Pierce College Tacoma Community College Workforce Central Job Corps Metropolitan Development Council Tacoma Community House Tacoma Goodwill Vadis Centro Latino Youth for Christ.

E N D
Core Partners • Tacoma Public Schools • Colleges • Bates Technical College • Clover Park Technical College • Pierce College • Tacoma Community College • Workforce Central • Job Corps • Metropolitan Development Council • Tacoma Community House • Tacoma Goodwill • Vadis • Centro Latino • Youth for Christ
Partnership of over 30 organizations to help at risk young adults • Co-located staff representing numerous programs • Outreach to At-Risk young people 16-24 • Year 1 1850 Young adults served 2010 • Year 2 2537 young adults served 2011 • Goodwill is a core partner and landlord proving the space
22 58 0 77 6 4 32 15 64 11 27 12 25 25 69 69 180 160 800
Age Groups (12 month period) 16- 9% 17 – 4% 18 – 18% 19 – 14% 20 – 13% 21 – 10% 22 – 8% 23 – 7% 24 – 7%
Ethnicity REACH Pierce Cty Native American 3% 1.1% Pacific Islander 3% 1.3% Asian 3% 5.8% Hispanic 8% 9.2% Bi/Multi Racial 19% 5.6% Caucasian 37% 70.3% Black 27% 6.5% Other .2% Gender 56% 44%