Download
1 / 21
210 likes | 318 Vues
Assessing Vaccination Coverage in Texas. Service Data and Coordination Group November 2007. Current Population Based Surveys in Texas. National Immunization Survey (NIS) Annual Report of Immunization Status Validation Survey Childcare Assessment (CCA)

E N D
Assessing Vaccination Coverage in Texas Service Data and Coordination Group November 2007
Current Population Based Surveys in Texas • National Immunization Survey (NIS) • Annual Report of Immunization Status • Validation Survey • Childcare Assessment (CCA) • Texas County Retrospective Immunization School Survey (TCRISS) – Small Area Analysis
Agenda • NIS and TCRISS • History • Advantages/Limitations • Select Results (Small Area Analysis)
NIS History • In 1993, the NIS was Established as a Joint Effort Between the National Center for Health Statistics (NCHS) and the National Immunization Program (NIP) to meet the federal Childhood Immunization Initiative, which Established Coverage Goals for Preschool Children • The Survey Began in April 1994 and is Currently On-Going
NIS Background • National Random-Digit-Dialing (RDD) Telephone Survey • Queries Parents of Children 19 to 35 Months on their Child’s Vaccination History and Some Demographics • Parental Consent to Contact Child’s Immunization Provider • Estimates Coverage By State and 28 Selected Urban Areas • Goal is to Complete 34,500 Nationwide Surveys Each Year
NIS • Limitations • Non-Telephone Bias • Non-Responses • No Vaccination Coverage Estimates for Population Subgroups or Small Areas • Advantages • Much Lower Cost than an In-Person Household Interviews / CATI • Vaccination Coverage Estimates are Based on Provider Data
Small Area Analysis History • In 2001, DSHS contracted with the Public Policy Research Institute (PPRI) at Texas A&M • Developed a new methodology to provide county level immunization rate estimates • Compared different data collection procedures (school immunization records, telephone interview, household interview)
Small Area Analysis Background • Advantages: • Lower cost compared to other methodologies • One immunization record in one location • 90% of the birth cohort attend public kindergarten in Texas • Limitations: • Data are at least three years old • Not a measure of current vaccination coverage • Can’t assess effectiveness of current interventions
TCRISS Process • DSHS Austin epidemiologists: • provide a list of schools to target and the number of records to pull per school • Run the analysis of the data using stat software that takes into consideration survey design • Provide written report back to LHD/HSR
TCRISS Process • LHDs/HSRs: • contact schools • collect immunization records • enter data into CoCASA • submit CoCASA records to DSHS Austin for analysis
Note on CASA/CoCASA • Software programs developed primarily for conducting individual provider assessments • Used for population assessments ONLY as a data collection tool • The CoCASA reports will not provide an accurate immunization rate for population assessment surveys unless all age eligible children in the county are included
Current Status • Using the PPRI methodology, to date 26 county retros conducted • In 2004, 14 were conducted in HSR 4/5N for KG cohort in SY 2003/2004 • In 2006, a retro was conducted in McLennan County (HSR 7) for KG cohort in SY 2005/2006 • In 2006, 11 were conducted in HSR 2/3, 7, and 8 for KG cohort in SY 2006/2007
Region 4/5 North 2003 Retro Immunization Survey Results-431 UTD 65.5% Bowie 62.1% 69.9% 65.1% Smith Rusk 62.4% 60.5% 50.0% Cherokee Trinity Houston San Augustine Nacogdoches 59.8% Sabine Angelina Newton Polk 63.7% Jasper San Jacinto 66.4% 63.2% 51.3% 58.3% 56.7%
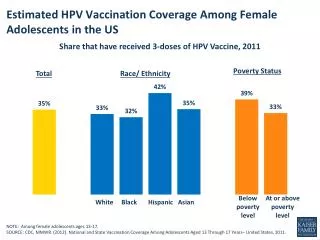
2005/2006 TCRISS Select Results – Vaccine Series, by 24 Months
2005/2006 TCRISS Select Results Other, by 24 Months • TCRISS Results Also Include County Vaccination Coverage Levels for : • 3 doses of Polio • 1 dose of MMR • 3 doses of Hib • 3 doses of Hep B • 3 doses of PCV (when available) • 1 and 2 doses of Hep A (when available)
Additional Requests for TCRISS Analysis, SY2006/2007 • Counties that currently have sample sets to complete a 2006 Small Area Analysis
Implications For TCRISS • County Level Data can be Available to Better Identify ‘Pockets of Need’ within the State • Immunization Coverage Rates can be Utilized with Other Demographic Data, when Available, to Further Assess the Needs of Specific Target Populations • Identify Further Education and Outreach Opportunities • Baseline Data to Monitor Change of Vaccination Coverage Rates Over Time
Questions? Debra Saxton, MS 512.458.7111, ext. 3948 -OR- Tony Aragon, MS 512.458.7111, ext. 6469