Download
1 / 27
280 likes | 419 Vues
Population Viability Analysis. IUCN RED LIST. Critically Endangered Threatened Endangered. Criterion Reduction in population size 10 yrs 3 generations. >80% >50% >30% <100 km 2 <5000 km 2 <20,000 km 2 <50 <250 <1000

E N D
IUCN RED LIST Critically Endangered Threatened Endangered Criterion Reduction in population size 10 yrs 3 generations >80% >50% >30% <100 km2 <5000 km2 <20,000 km2 <50 <250 <1000 >50% >20% >10% 10 yrs 20 yrs 100 yrs Or 3 gen or 5 gen Small range Very Small population Quantitative analysis Probability of extinction
Population Viability Analysis (L14 and L15) What is it? How do the models work Uses Issues Accuracy More uses - case studies Additional reading (FYI) Papers for next week Principles of Conservation Biology pp 433-35 Intro to Conservation Genetics Ch 20
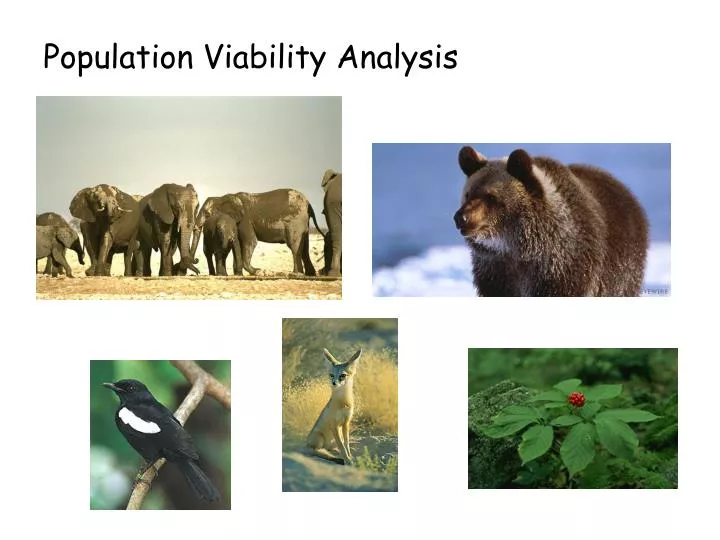
Exotic species Poaching Habitat loss Pollution Small population Catastrophes Management options Fluctuating population size Human impact Environment Disease Life history Inbreeding PVA models examine the effects of different life histories, environmental and threat factors on the population size and extinction risk of populations
BASIC APPROACH Collect population data size and number populations birth and death rates habitat capacities (K) frequency and effect of threats Put into PVA model package VORTEX, GAPPS, RAMAS, ALEX Predict extinction probabilities
BASIC MODEL- count-based PVA Breed Immigrate Supplement One Pop’n N Census Death Emigrate Harvest Truncate at K Run for 50-100 Generations
BASIC MODEL - count based PVA PVA models are NOT deterministic Models need following data Variance in fecundity Variance in survival Variance in K Form of density dependence Frequency/magnitude of catastrophes Covariance in demographic rates Q. What does deterministic/variance/covariance mean?
BASIC EXAMPLE Silvereyes on Heron Island Model Initial N=375 Productivity and survival (26 yrs of data) Catastrophes - cyclones in Jan/April - chance of event 7.5% - effect on mortality +22% K = 450 (± 10%) Brook and Kikkawa 1998
Cyclone-Jan or April Set K Breed One Pop’n N Census Death Truncate at K Run for 100 years
MODEL OUTPUT N Year Chance of extinction in 100 yrs = 15%
ADDING COMPLEXITY 1. Individuals are different Eg 1 Elephants only breed after 10+ years productivity increases and then declines have age specific mortality rates Eg 2 Red cockaded woodpeckers breed in groups may float prior to joining a group one male breeds, others help Q. How would you alter the PVA model?
MORE COMPLEX MODEL Breed Immigrate Supplement N at each AGE or STAGE Census Each St(age) Death Emigrate Harvest Truncate at K Individuals age or change categories
Stage-structured PVAs Additional Data Requirements St(age)-specific productivity St(age)-specific survival Transition probabilities between stages
ADDING COMPLEXITY 2. additional populations ---> multi-site PVAs Simple - presence/absence - use IFM to estimate extinction/ colonisation - model viability of metapopulation Complex - spatially-explicit individual based models - track individuals in complex landscape as they are born, move, die - landscape can be “patches” or “real”
Multi-site PVAs Additional Data Requirements IFM - ??? Spatially explicit individual based- ??? Data needed – check metapopulation and corridor lectures
WHAT ARE PVA models HOW DO THEY WORK USES OF PVA 1. Assessing extinction risk ISSUES WITH PVAs ACCURACY of PVAs ALTERNATIVE USES
1. Assessing the extinction risk of population Figure 55.11 Grizzlies in Yellowstone National Park Shaffer (1978,1983) and others since
1. Assessing the extinction risk of population Grizzlies in Yellowstone National Park Shaffer (1978,1983) and others since Age-structured model (cubs, 1..4, 5…25) Sex (male, female) Data - 12 yrs Craighead, YNP Environmental stochasticity -->productivity Demographic stochasticity --->sex of cubs K= 230; M + F + cubs Craighead, YNP
1. Assessing the extinction risk of population Grizzlies in Yellowstone National Park Shaffer (1978,1983) and others since Age-structured model Sex Data - 12 yrs Environmental stochasticity RESULTS Size Probability of persisting 100yrs 10 0 20 0.36 30 0.74 40 0.94 50 0.98
AREA REQUIRED Update 1975 - 136 bears in Yellowstone 2004 - 580 and rising 2005 - proposal to delist grizzlies from ESA 2007- population 500+ grizzlies delisted - no protection outside park
Issues with PVA models - 1 Population at risk are typically examined using density-dependent single species model. Environmental factors are included by varying K Interactions between populations and environment appear as reduction in realized rate of increase as population size approaches K Issues with PVA models - 2 Data requirements are far greater than the amount of data available for most species Rubbish in ----> rubbish out
Issues with PVA models - 3 PVAs typically do not incorporate all genetic effects on population viability Q. What genetic processes could influence viability? PVAs can incorporate inbreeding depression BUT how susceptible are populations? what fitness components are affected? how is inbreeding depression related to F? is purging likely? is inbreeding depression greater during catastrophes? etc etc
HOW ACCURATE ARE PVAs? Brooks et al. 2000 Used 21 long term (> 10 year) datsets Used first half of data to set up models Tested predictions from 5 PVA packages = probability of population decline with what actually happened afterwards = did population decline
HOW ACCURATE ARE PVAs? Brooks et al. 2000
HOW ACCURATE ARE PVAs? Brooks et al. 2000 “PVA is a valid and sufficiently accurate tool for categorizing and managing endangered species” Coulson et al. 2001 Response The 21 studies selected were biased the data available was of very high quality most species were not endangered PVAs will frequently be unreliable because the data to estimate vital rates is limited and vital rates of endangered spp will change
Puerto Rican parrot Black footed ferret What sort of PVA model is appropriate? DISCUSS What is gained from using PVAs?
Next MORE USES OF PVA Assessing the extinction risk of population Comparing the relative risk in 2+ populations Identify key life history stages to protect Determining minimum reserve size Determining numbers to release Setting harvest guidelines Deciding how many (which) populations are needed