Download
1 / 27
270 likes | 395 Vues
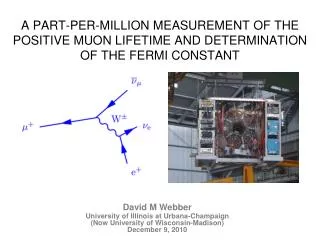
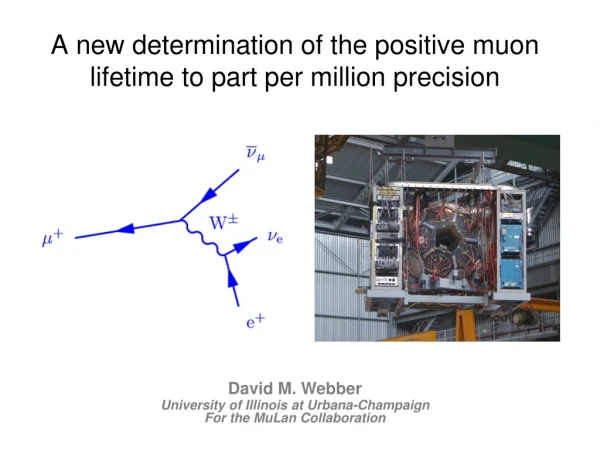
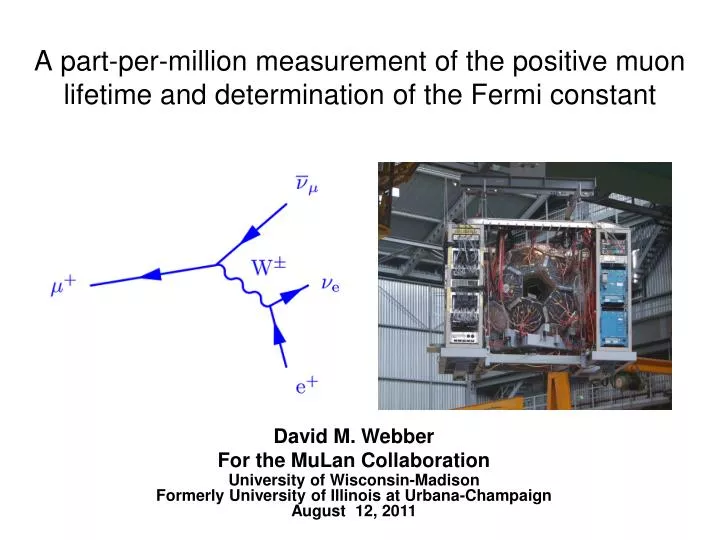
A part-per-million measurement of the positive muon lifetime and determination of the Fermi constant. David M. Webber For the MuLan Collaboration University of Wisconsin-Madison Formerly University of Illinois at Urbana-Champaign August 12, 2011.

E N D
A part-per-million measurement of the positive muon lifetime and determination of the Fermi constant David M. Webber For the MuLan Collaboration University of Wisconsin-Madison Formerly University of Illinois at Urbana-Champaign August 12, 2011
The predictive power of the Standard Model depends on well-measured input parameters What are the fundamental electroweak parameters (need 3)? a GF MZ sin2qw MW 0.00068 ppm 8.6 ppm 23 ppm 650 ppm 360 ppm * circa 2000 Obtained from muon lifetime Other input parameters include fermion masses, and mixing matrix elements: CKM – quark mixing PMNS – neutrino mixing
Contains all weak interaction loop corrections Dq The Fermi constant is related to the electroweak gauge coupling g by In the Fermi theory, muon decay is a contact interaction where Dq includes phase space, QED, hadronic and radiative corrections In 1999, van Ritbergen and Stuart completed full 2-loop QED corrections reducing the uncertainty in GF from theory to < 0.3 ppm (it was the dominant error before) D. M. Webber
450 MHz WaveForm Digitization (2006/07) MHTDC (2004) The experimental concept… 170 Inner/Outer tile pairs Real data Kicker On Measurement Period Number (log scale) time Fill Period -12.5 kV 12.5 kV
MuLan collected two datasets, each containing 1012 muon decays Two (very different) data sets Different muon stopping targets Different blinded clock frequencies used Revealed only after all analyses of both data sets completed Most systematic errors are common Datasets agree to sub-ppm Ferromagnetic Target, 2006 Quartz Target, 2007
Challenging Leading systematic considerations:
Waveform Digitizers 2 Analog Pulses 1/6 of system 170 scintillator tile pairs readout using 450 MHz waveform digitizers. x2 1 clock tick = 2.2 ns D. M. Webber
Gain variation vs. time is derived from the stability of the peak (MPV) of the fit to pulse distribution If MPV moves, implies greater or fewer hits will be over threshold 0 10 20 ms Carefully studied over the summer of 2010. Gain correction is 0.5 ppm shift with 0.25 ppm uncertainty. 8
Raw waveforms are fit with templates to find pulse amplitudes and times >2 x 10¹²pulses in 2006 data set >65 TBytes raw data inner A difficult fit Normal Pulse ADT Template outer Two pulses close together D. M. Webber
Measured t vs. Deadtime Normal Time Distribution RawSpectrum Pileup Corrected Pileup Time Distribution Leading order pileup to a ~5x10⁻⁴ effect • Statistically reconstruct • pileup time distribution • Fit corrected distribution Fill i Fill i+1 1/t– 2/t 2/t
R (ppm) 1 ppm 150 ns deadtime range Artificial Deadtime (ct) Pileup to sub-ppm requires higher-order terms • 12 ns deadtime, pileup has a 5 x 10⁻⁴ probability at our rates • Left uncorrected, lifetime wrong by 100’s of ppm • Proof of procedure validated with detailed Monte Carlo simulation uncorrected Pileup terms at different orders …
The pileup corrections were tested with Monte-Carlo. Monte-Carlo Simulation, 1012 events agrees with truth to < 0.2 ppm 1.19 ppm statistical uncertainty D. M. Webber
Lifetime vs. artificially imposed deadtime window is an important diagnostic A slope exists due to a pileup undercorrection 1 ppm 150 ns deadtime range Extrapolation to 0 deadtime is correct answer D. M. Webber 13 Pileup Correction Uncertainty: 0.2 ppm
Explanations of R vs. ADT slope • Gain stability vs. Dt? • No. Included in gain stability systematic uncertainty. • Missed correction? • Possibly • Extrapolation to ADT=0 valid • Beam fluctuations? • Likely • Fluctuations at 4% level in ion source exist • Extrapolation to ADT=0 valid D. M. Webber
ppm tm + Dsecret 22 ms 2006: Fit of 30,000 AK-3 pileup-corrected runs. 2007: Quartz data fits well as a simple sum, exploiting the symmetry of the detector. The mSR remnants vanish.
Variations in tmvs. fit start time are within allowed statistical deviations D. M. Webber
Final Errors and Numbers ppm units t(R06) = 2 196 979.9± 2.5 ± 0.9 ps t(R07) = 2 196 981.2 ± 3.7 ± 0.9 ps t(Combined) = 2 196 980.3 ± 2.2 ps (1.0 ppm) Dt(R07 – R06) = 1.3 ps
Results t(R06) = 2 196 979.9± 2.5 ± 0.9 ps t(R07) = 2 196 981.2 ± 3.7 ± 0.9 ps t(Combined) = 2 196 980.3 ± 2.2 ps (1.0 ppm) Dt(R07 – R06) = 1.3 ps The Result New GF GF(MuLan) = 1.166 378 8(7) x 10-5 GeV-2 (0.6 ppm)
The lifetime difference between tm+ and tm- in hydrogen leads to the singlet capture rate LS 1.0 ppm MuLan ~10 ppm MuCap log(counts) MuCap nearly complete μ+ μ – time The singlet capture rate is used to determine gPand compare with theory gP
In hydrogen: (1/tm-)-(1/tm+) = LS gPnow in even better agreement with ChPT* Shifts the MuCap result Using previous tm world average Using new MuLan tm average *Chiral Perturbation Theory 20
MuLan Collaborators 2004 Institutions: University of Illinois at Urbana-Champaign University of California, Berkeley TRIUMF University of Kentucky Boston University James Madison University Groningen University Kentucky Wesleyan College 2006 2007 D. M. Webber
Conclusions • MuLan has finished • PRL published. Phys. Rev. Lett. 106, 041803 (2011) • 1.0 ppm final error achieved, as proposed • PRD in preparation • Most precise lifetime • Most precise Fermi constant • Influence on muon capture • Shift moves gP to better agreement with theory • “Eliminates” the error from the positive muon lifetime, needed in future m- capture determinations (e.g. MuCap and MuSun) t(R06) = 2 196 979.9± 2.5 ± 0.9 ps t(R07) = 2 196 981.2 ± 3.7 ± 0.9 ps t(Combined) = 2 196 980.3 ± 2.2 ps (1.0 ppm) Dt(R07 – R06) = 1.3 ps GF(MuLan) = 1.166 378 8(7) x 10-5 GeV-2 (0.6 ppm)
Backup D. M. Webber
For 1ppm, need more than 1 trillion (1012) muons ... πE3 Beamline, Paul ScherrerInstitute, Villigen, Switzerland
Gain is photomultiplier tube type dependent Artifact from start signal Deviation at t=0 1 ADC = 0.004 V Sag in tube response 0 10 20 ms D. M. Webber
Introducing higher-order pileup A B C D E F G triple hit hit pileup Inner tile Artificial deadtime Artificial deadtime Artificial deadtime time time Outer tile Artificial deadtime D. M. Webber
The push – pull of experiment and theory • Muon lifetime is now the largest uncertainty on GF ; leads to 2 new experiments launched: MuLan & FAST • Both @ PSI, but very different techniques • Both aim at “ppm” level GF determinations • Both published intermediate results on small data samples • Meanwhile, more theory updates !!