Download
1 / 7
70 likes | 167 Vues
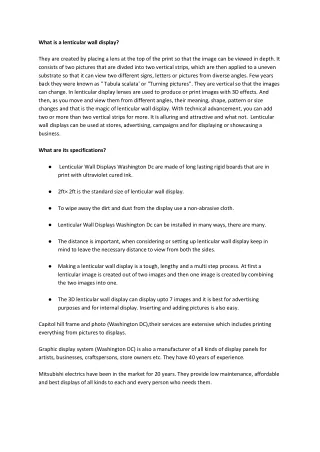
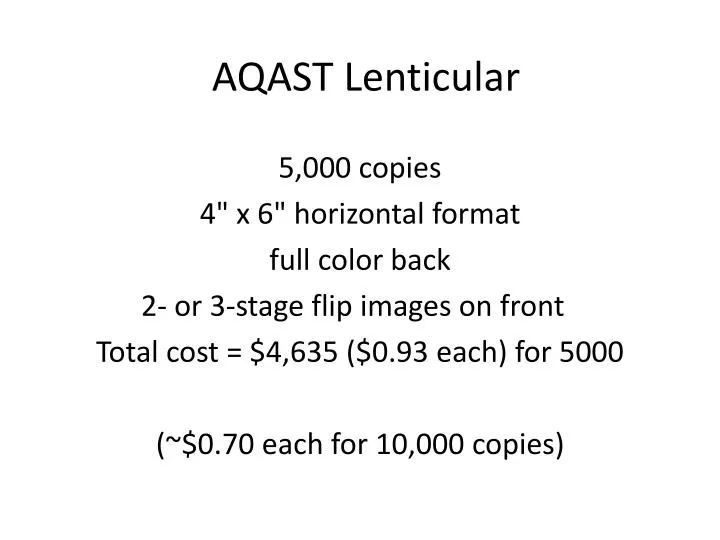
AQAST Lenticular. 5,000 copies 4" x 6" horizontal format full color back 2- or 3-stage flip images on front Total cost = $4,635 ($0.93 each) for 5000 (~$ 0.70 each for 10,000 copies ). Very Popular Aura OMI Lenticular : One to Advertise AQAST to AQ Community?.

E N D
AQAST Lenticular 5,000 copies 4" x 6" horizontal format full color back 2- or 3-stage flip images on front Total cost = $4,635 ($0.93 each) for 5000 (~$0.70 each for 10,000 copies)
Very Popular Aura OMI Lenticular: One to Advertise AQAST to AQ Community?
Show decrease in US emissions as indicated by OMI. Maybe only show eastern U.S.? Mean SO2 values for 2005-2007 2005 IMAGE #1
Mean SO2 values for 2008-2010 2010 IMAGE #2
Lights at Night Or Locations of Cities & Power Plants? IMAGE #3
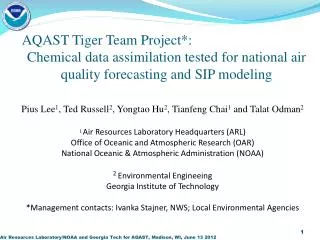
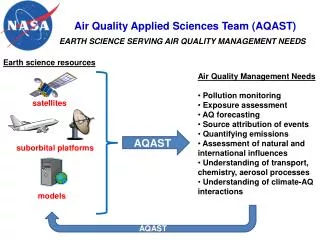
NASA AQAST: Serving the Needs of US Air Quality Management The NASA Air Quality Applied Sciences Team (AQAST) was created in 2011 by the NASA Applied Sciences Program to serve the needs of US air quality management through the use of Earth Science satellite data, suborbital data, and models. AQAST members have expertise in the wide array of Earth Science tools and data sets available from NASA and other agencies. They have the resources to carry out quick-turnaround projects responding to urgent and evolving needs of air quality management. The advantage of satellite data for monitoring changes in air pollutants is shown by nitrogen dioxide (NO2) and sulfur dioxide (SO2) data from the Ozone Monitoring Instrument (OMI), onboard the Earth Observing Satellite Aura (http://aura.gsfc.nasa.gov/). NO2 and SO2 decreased significantly from 2005 to 2011 (See maps A. & B. at left.) as a result of federal and state efforts to decrease NOx and SO2 emissions. NO2 is regulated as it is unhealthy to breathe and also reacts with other gases to produce high levels of ozone, which is dangerous to breathe. SO2 is regulated as it is unhealthy to breathe and it contributes to acid rain. More information about AQAST and its activities is available at http://acmg.seas.harvard.edu/aqast/.
NASA AQAST: Serving the Needs of US Air Quality Management The NASA Air Quality Applied Sciences Team (AQAST) was created in 2011 by the NASA Applied Sciences Program to serve the needs of US air quality management through the use of Earth Science satellite data, suborbital data, and models. AQAST members have expertise in the wide array of Earth Science tools and data sets available from NASA and other agencies. They have the resources to carry out quick-turnaround projects responding to urgent and evolving needs of air quality management. The advantage of satellite data for monitoring changes in air pollutants is shown by nitrogen dioxide (NO2) data from the Ozone Monitoring Instrument (OMI), onboard the Earth Observing Satellite Aura (http://aura.gsfc.nasa.gov/). NO2 decreased significantly from 2005 to 2011 (See maps A. & B. at left.) as a result of federal and state efforts to decrease NOx emissions, as NO2 is unhealthy to breathe and also reacts with other gases to produce high levels of ozone, which is dangerous to breathe. The intensity of city lights (C.), measured by the Defense Meteorological Satellite Program (DMSP) Operational Linescan System (OLS), is an excellent indicator of the sources of pollution. The brightest lights coincide with the most urbanized, populated, and, consequently, polluted areas in the U.S. More information about AQAST and its activities is available at http://acmg.seas.harvard.edu/aqast/.