Download
1 / 13
140 likes | 461 Vues
NEW!. Diagnostic possibilities with Micro/WIN V4 and S7-200 PLC’s. Diagnostic and Debugging features. The new Diagnostic and Debugging features in the new Hardware and Software. + Event History file + Trend chart + Diagnostic LED. Diagnostic/Debug. NEW!.

E N D
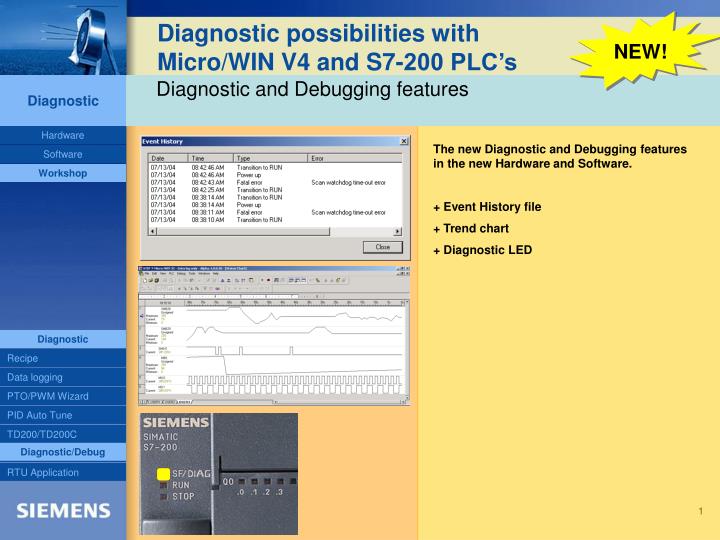
NEW! Diagnostic possibilities with Micro/WIN V4 and S7-200 PLC’s Diagnostic and Debugging features The new Diagnostic and Debugging features in the new Hardware and Software. + Event History file + Trend chart + Diagnostic LED Diagnostic/Debug
NEW! Diagnostic possibilities with Micro/WIN V4 and S7-200 PLC’s Event History Log file The new Event History log file The Event History Log file is a standard diagnostic tool available in all innovated S7-200 PLC’s and in 224XP. PLC 221 and 222 up to 4 entriesPLC 224, 224XP and 226 up to 8 entries. Diagnostic/Debug
NEW! Diagnostic possibilities with Micro/WIN V4 and S7-200 PLC’s Event History Log file • Open the Communication dialog. • Scan you network via “Double Click on refresh” to find the connected S7-200 units. • Double Click on the PLC where you want to see the Event History Log file. 1 3 2 Diagnostic/Debug
NEW! Diagnostic possibilities with Micro/WIN V4 and S7-200 PLC’s • Event History Log file • Select “Event History” to open the Event History Log file. • Now you can read the latest entries in the Event History Log file. 2 Diagnostic/Debug 1
NEW! Diagnostic possibilities with Micro/WIN V4 and S7-200 PLC’s Event History Log file 3 4 5 The Event History Log file contains: 3. Power UP information 4. Transitions into RUN 5. Fatal Error information If the real time clock is set then you get also a time and date stamp. Diagnostic/Debug
NEW! Diagnostic possibilities with Micro/WIN V4 and S7-200 PLC’s Diagnostic LED How to use the new Diagnostic LED: Diagnostic/Debug
NEW! Diagnostic possibilities with Micro/WIN V4 and S7-200 PLC’s Diagnostic LED How to use the new Diagnostic LED: The new SF/DIAG LED has two colors: + RED for Error conditions+ YELLOW for Diagnostic condition RED: The LED lights in RED color if a fatal ERROR occurs. Please see the Error information in the S7-200 System manual. YELLOW: The LED lights in YELLOW in the following conditions:+ forced of an address+ I/O module error+ controlled by the user program RED: YELLOW: Diagnostic/Debug
NEW! Diagnostic possibilities with Micro/WIN V4 and S7-200 PLC’s Diagnostic LED To control the Diagnostic LED by user program open the “Program-Control” instruction and use the function DIAG_LED in you S7-200 User program. DIAG_LED: To control the Diagnostic LED by user program. IN: Byte address. So you can use 8 binary addresses at the same time. Tip: A flashing in different frequencies is possible so you can separate different diagnostic conditions. Diagnostic/Debug
NEW! Diagnostic possibilities with Micro/WIN V4 and S7-200 PLC’s The new Micro/WIN V4 Trend Chart for easy maintenance and error identification. New feature in Micro/WIN V4 Trend Chart + Part of Micro/WIN V4 + Works with the Micro/WIN communication interface (PPI, Modem, Ethernet) + Data format support like the Status chart (V, M, SM, C, T, AIW, AQW, …….) Diagnostic/Debug
NEW! Diagnostic possibilities with Micro/WIN V4 and S7-200 PLC’s The new Micro/WIN V4 Trend Chart for easy maintenance and error identification. • Create a status chart with all the addresses you want to monitor. • Start the status chart. • View the status chart in trend view. • Pause the trend chart for better investigation • TIP: The easiest way to create a Status chart:Mark your networks in your program editor (LAD, STL or FBD), press the right mouse button and select “Create Status chart”. 1 2 3 4 Diagnostic/Debug
NEW! Diagnostic possibilities with Micro/WIN V4 and S7-200 PLC’s The new Micro/WIN V4 Trend Chart for easy maintenance and error identification. 1 You can:+ select several options + the display format + the time base (update rate)+ directly write values or force to a selected value.+ add or delete variables.+ set the scale of each chart in the Properties if you like. Diagnostic/Debug
NEW! Diagnostic possibilities with Micro/WIN V4 and S7-200 PLC’s • Additional questions: • Can I record the data with Microsoft Excel?No, this is a Online-feature like the status of the status chart. To record some data you better use the Data Logging wizard and a new MC-card. • Can I use it also with the current S7-200 PLC’s?Yes, the trend chart is also working with the current S7-200 PLC’s. • I know my signal is changing but I only see a line. What’s wrong?The time base (update rate) of the trend chart is to slow or the signal is changing faster than 0.5 seconds. • Can I use the trend chart via modem/Ethernet?Yes, the trend chart is working if you can connect to the PLC via Micro/WIN V4. Diagnostic/Debug
Diagnostic possibilities with Micro/WIN V4 and S7-200 PLC’s End of presentation! Diagnostic/Debug