Download
1 / 40
400 likes | 562 Vues
Colin Creighton with Dr Shahbaz Khan & Dr Rod Oliver Sustainable Water Management Conference ANU September 2005. Water for a Healthy Country. Unlocking systems - the key to sustainability Food, Fish & People. World Population Growth – Key Driver. World. World.

E N D
Colin Creighton with Dr Shahbaz Khan & Dr Rod Oliver Sustainable Water Management Conference ANU September 2005 Water for a Healthy Country Unlocking systems - the key to sustainability Food, Fish & People
World World Expansion in Global Irrigation Areas In 2001, 40% of agricultural products and 60% of grains were grown on irrigated land
Food, Fish & People • An extra 1.5-2.0 billion people by 2025 • About 29% more irrigated land required by 2025 • Assuming gains in productivity and more efficient water use the increase in diversions to agriculture will be 18% [IWMI] • A 8% decrease in the amount of water that should be diverted to irrigation over the next 25 years for fisheries / river & estuary health • The additional water for irrigated agriculture-food is about 625km3 of water – or close to the amount of water (800km3) that is presently used globally for industrial and urban use We have a global responsibility
Agronomic Challenge to Improve Water Productivity 3.8 tons/ha 1.7 tons/ha After FAO
Environmental Water Stress – Crude Indicator of “Fisheries as Food Status” Indus Basin Pakistan
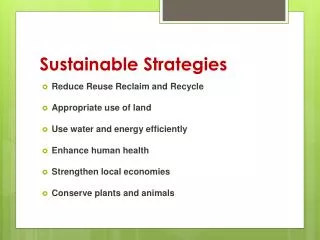
The Science Challenge • Our Thesis – By better understanding the biophysical, economic and social systems we will be able to identify key pressure points for improved productivity • Key Components – • Catchment Yield [Quality & Quantity] & Land Use Change • Water Budgets, Use, Practice, Productivity & Profitability • Ecological Assets, Repair Needs & Opportunities • Institutional Context, Constraints & Opportunities • A work in progress……..well underpinned by the Council of Australian Government “continuous improvement” in water policy……….and with international applications
water land use,dams, fires climate revegetation irrigation efficiency waterregimes salinity costs investment costs Murray water benefit system THE MURRAY REGION WATER BENEFIT SYSTEM lever water use water benefit rainfall 150,000 GL upland catchments dryland agriculture, forestry water & salt groundwater Riverine Plains irrigation $ net returns floodplains, river 2,500 GL non-$ 8,000 GL ecological outcomes $ 3,000 GL Lower Murrayirrigation Coorong, Lower Lakes and Mouth All water has value in this system. How can we use it more smartly to increase benefits?
Irrigated areas, Murray Basin Pop: 583,000 Irrigated farms 25,000 Irrigated area 1.243m ha
…….with substantial water diversion MDBC CAP on Diversions
Water diverted and delivered by region (2001/02) Totals: Water entitlements 7,734 GL Groundwater 602 GL Surface diversion 8,608 GL Water delivered 6,656 GL Irrigation requirement 8,367 GL Water transpired~ 4,000 GL
Irrigation application systems Total ratio by area Surface:sprinkler:micro 83 : 10 : 7
Murrumbidgee System Water Account (1991) …..finding water through accounting for flows, losses & uses
….including channel leakage & reconfiguration One Channel Loses over 10 GL/yr
Capital investment and total water savings - irrigation technologies
On-farmMurrumbidgee & Coleambally Irrigation Areas Water Savings Environmental Benefit 2.0 to 4.0 ML/ha Converting Irrigation Systems ↓ subsurface drainage↓surface drainage 0.1 to 3 ML/ha Relocating rice to suitable locations Increasing investment$50 - $7,000 /ML 1 to 4% of supply Lining on-farm channels ↓ accessions to watertable ↓ salinity 0.1 to 0.4 ML/ha Laser levelling 0.2 to 2.5 ML/ha Irrigation flow monitoring ↓ accessions to watertable 0.1 to 3 ML/ha Soil + ground water monitoring
Off-farmMurrumbidgee & Coleambally Irrigation Areas Environmental Benefit Water Savings reduction in recharge abatement cost production and environmental benefits Providing ecosystem services 10 to 30% increase in water security promotion of water efficient community Incentives for efficient water use 20 – 50 GL Increasing investment $500 - $7,000 /ML Reducing evaporation losses ↓ accessions to watertable ↓salinity 15 – 70 GL Piping channels 10 – 50 GL ↓accessions to watertable Sealing leaky channels 100 – 200 GL match demand with supply Closer monitoring and delivery Monitoring and delivery
Efficiencies in Murrumbidgee Irrigation AreaGL 2000/01 Total watersupply1630 Shallow ground-water Irrigation water (surface) 118 Current 1048 1419ET 87% Water use efficiency 91% Off-farm conveyance 90% 95% 946 Edge of farm 1,300,241tonnes Irrigation water (groundwater) 88% On-farm conveyance 798t/GL Water productivity 90% 836 836 Edge offield 26 89% Field efficiency $322m profit 95% 1162 $198K/GL Economic return 439 Root zone $207 Rainfall 18 Applying project results 75 GL saved +$14m profit Regional groundwater
SIX SIGNIFICANT ECOLOGICAL ASSETS FOR THE LIVING MURRAY • Sourcing and allocating water for the environment • 500 GL within 5 years • Six significant ecological assets based on remnant vegetation, internationally significant wetlands (Ramsar) • River channel included • Improve water delivery to enhance floodplain vegetation, bird and fish populations Based on MDBC Web site: Ministerial Council Communique Nov 2003
Interconnecting Aquatic System Framework Floodplain inundation Wetland inundation Riparian inundation Upland Groundwater interactions Floodplain Wetland biotic Floodplain biotic Riparian biotic Water yield Out of channel discharge Organic material delivery Nutrients Salinity accessions Littoral and Eulittoral Water quality Interface Channel discharge Decomposition Channel Channel secondary biotic Channel primary biotic Channel structure Channel hydrodynamics
River connections • Channel • Flow patterns • Channel morphology • Habitat
River connections • Channel • Flow patterns • Channel morphology • Habitat • Connectivity • Hydrological • Material exchange
River connections • Channel • Flow patterns • Channel morphology • Habitat • Floodplain Water Regime • Frequency • Timing • Duration • Depth • Connectivity • Hydrological • Material exchange
River connections • Channel • Flow patterns • Channel morphology • Habitat • Floodplain Water Regime • Frequency • Timing • Duration • Depth • Connectivity • Hydrological • Material exchange • Wetland Water Regimes • Geomorphology • Duration
River connections • Channel • Flow patterns • Channel morphology • Habitat • Floodplain Water Regime • Frequency • Timing • Duration • Depth • Connectivity • Hydrological • Material exchange • Groundwater • recharge • Movement • Salinity • Wetland Water Regimes • Geomorphology • Duration
River connections Community Distributions Biotic response curves • Primary Producers • Secondary Producers • Fish • Floodplain vegetation • Wetland vegetation • Fauna Biotic Outcomes • Channel • Flow patterns • Channel morphology • Habitat • Floodplain Water Regime • Frequency • Timing • Duration • Depth • Connectivity • Hydrological • Material exchange • Groundwater • Recharge • Movement • Salinity • Wetland Water Regimes • Geomorphology • Duration
Flow GL/day Flood Inundation Model Mildura Flows 1956 Flood Extent
Key Ecological Components – all temporal & spatial challenges • River channel structure, nutrient turnover and biota – various flow regimes • Ecological benefits of floods – natural and induced • Diversity and health of native floodplain vegetation • Connectivity between floodplain and river habitats that maximises productivity • Native fish abundance [and birds] – scenarios, predictive capacity for population projections and habitat repair strategies Systems Complexities, Interactions & Feedback Loops to Water Use, Water Benefits & Institutional Settings – a work in progress!
colin.creighton@csiro.au Sustainable Water Management Conference ANU September 2005 Smart Solutions for Australia’s Water Issues Thank you and questions?