Download
1 / 49
490 likes | 592 Vues
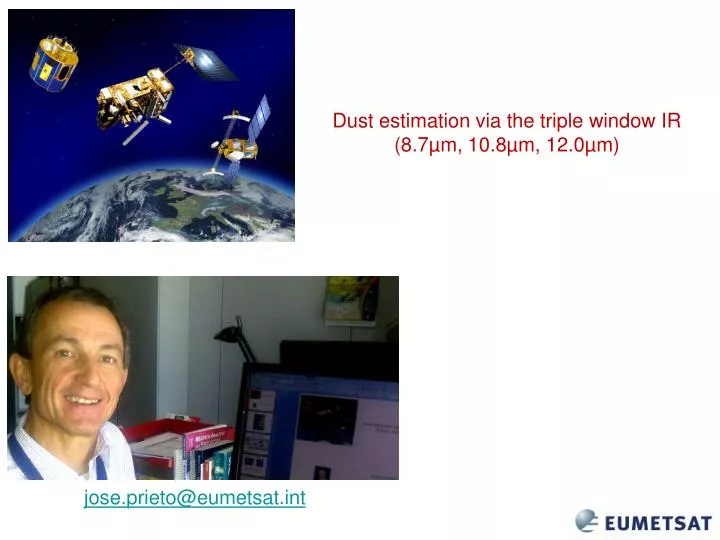
Dust estimation via the triple window IR (8.7µm, 10.8µm, 12.0µm). jose.prieto@eumetsat.int. Can a satellite see dust particles ?. Dust particle 10 µm . Earth globe 10 Mm . From micro to mega, twelve orders of magnitude difference in size

E N D
Dust estimation via the triple window IR(8.7µm, 10.8µm, 12.0µm) jose.prieto@eumetsat.int
Can a satellite see dust particles ? Dust particle 10 µm Earth globe 10 Mm • From micro to mega, twelve orders of magnitude difference in size • 1012 kg in the atmosphere (10-7 of atmospheric mass) = fill all lorries! • Disputed human contribution to global cooling (S.K. Satheesh, 2006) • Trace for atmospheric circulation (polluting cars) • Life vector (Saharan protozoa and bacteria to the Caribbean)
Better dust detection in the infrared? • On IR imagery, dusty air appears cool in contrast to the hot daytime land surface. At night, the thermal difference between the background and the dust lessens. • On VIS imagery over water, dust is easy to note. Over land, however, the dust plume and dry surfaces look similar Click one of the four fields, the one with best contrast between free-surfaces and dust areas Consecutive days in Fuerteventura, January 2010
Dust on visible and infrared 2004-05-13 13:00 UTC, 0.8 µm Same date and time, 10.8 µm • Dust reflects back solar energy to space • Dusty air rises and cools down Desert scene, Southern Sudan
DUST RGB composite:the strength of infrared for dust detection IR RGB composite based on channels at 8.7, 10.8 and 12.0 µm Solar RGB composite based on channels at 1.6, 0.8 and 0.6 µm
Aerosol and health World Atlas of Atmospheric Pollution. Editor: R. S. Sokhi Impact on: agriculture (fertile fields), climate (radiative balance), aviation (ash in routes)
Aerosol is more than dust Dust Marine salt Smoke (industrial carbon, biomass burn) Ash Pollen Ice crystals ? Jun2000-May2001 Average aerosol NASA Earth Observatory
Contents • Infrared dust properties • Where you learn how cool dust really is • A model of atmospheric dust • Where you learn to distinguish high thin from low fat • Validation via AERONET • Where you learn that models can help your eyes • Mixed scenes: cloud and dust • Where you learn that dust associates with water • Conclusions • Where you learn that there is more dust on books than books on dust
Dust characteristics • Dust storms occasionally reach up to 1km | 5 km | 10 km height, and are as thick as 100m | 1km | 5 km • Dust optical depth is around 0.1 | 0.5 | 1 (average on land) or 3 | 10 | 50 for storms, in the visible range. Optical thickness in the IR is about 40% of those values. • Dust absorbs and scatters infrared radiation in the Mie | Rayleigh | opticalregion • Aerosol density average in the atmosphere 10-7 kg/m3 ( equivalent of depth 0.1 | 1 | 3 )
Dust characteristics • Dust storms occasionally reach 5kmheight, frequently thicker than 1km • Dust optical depth around 0.5 (average on land) or 3 for storms, in the visible range. Optical thickness in the IR is about 40% of those values. • Dust absorbs and scatters infrared radiation in the Mie region • Aerosol density average in the atmosphere 10-7 kg/m3 ( equivalent of depth 0.1) • Dusty air ~ AOD=1 ~ 1 mg/m3 ~ 1 g/m2 Σscat Σabs 0.55µm section
Dust enhancement in a single IR channel (?) (280-293K) 2004 May 13th 13:00 Meteosat 10.8µm colour-enhanced (left) and gray-enhanced (below) 8.7 µm 10.8 µm 12.0 µm
Ch9 (upper left) and three independent differences 10.8µm 10.8-12µm (-7K, 12K) 8.7-10.8µm (-19K, 5K) (-19K, 12K)
The 10.8µm-12µm difference (vertical) Ch 10.8µm Dust
Comparison of water cloud and dust in the IR window Low cloud Dust storms 8.7 µm 10.8 µm 12.0 µm
dust particle Absorption + scattering efficiencies Abs+ scatter Thin dust < 0.5 absorbs more 10.8µm 12.0µm goes forward 10.8µm 12.0µm Ground contribution Dust contribution Emissivity=0.90 Emissivity=0.75 Emissivity=0.25 Emissivity=0.15 :::::::::::::::::::::::::::::::::::::::::::::::::::: :::::::::::::::::::::::::::::::::::::::::::::::::::: Thick dust > 1.5 emits more 10.8µm ::::::::::::::::::::::::::::::::::::::::::::::::::::
“Reversed arc” for dust scenes: Ch9-Ch10 versus Ch10 MSG Natural (solar) RGB composite 4-July-2003 10:00 UTC • 10.8µm radiation is more absorbed and more backscattered by dust than 12.0µm • For dust or ash, arc is inverted due to the thinner contribution layer at 10.8µm • 10.8µm channel shows higher BT than 12µm for thick dust due to higher emissivity
Exercise: plot 9-10 versus 10 Why is the brightness temperature difference Ch9-Ch10 turning positive for very thick dust layers? • Dust shows a higher emissivity at Ch9 than at Ch10 • Water vapour condenses on dust and favours Ch9 emissivity over Ch10 emissivity • Dust has a scattering component, higher at Ch9 than at Ch10 • Dust Ch10 signal comes from a thicker (and therefore warmer) top layer T Ex F NEx T NEx T NEx Ex: explains NEx: does not explain
Contents • Infrared dust properties • Where you learn how cool dust really is • A model of atmospheric dust • Where you learn to distinguish high thin from low fat • Validation via AERONET • Where you learn that models can help your eyes • Mixed scenes: cloud and dust • Where you learn that life is impossible without water • Conclusions • Where you learn that there is more dust on books than books on dust
Dust model • Dust tends to higher levels far from the source, decreasing in particle size • Decrease in 12.0µm BT due to height and dust thickness (and size and...) Dust Colder ground Ground dust source 200 km Dust branch Ground branches
Model assumptions (limitations) • (32x32 surroundings): min T10.8-T12.0 < -1.3K • Empirical AOT estimates for channel saturation: 0.14----1.3----3.5----4.8 • Uniform dust type • Dust in the pixel at a single height • Size not dependent on height • Ground temperature affected by thick dust above • Good results in areas 200 km across • Four result categories: • Dust-free (or low-level only, or night-time, or dry ground) • Only dust traces • Dust • Mixed with cloud
270 K Graphical analysis 290 K 310 K 295 K • Thick dust cloud at low level can be confused with a thin layer high above • Reduction of the ground temperature by dust screening the sun (‘thermal deficit’) • Use channel difference 8.7µm – 10.8µm (negative for thin, positive for thick) (Tg=310, Td=290) Ch 9-Ch10 (Tg=295, Td=270) (Tg=310, Td=270) Channel10 BT Green-red dotted curve for (Tground=295, Tdust=270) Cyan curves for Tg=310, and two values of Td=270 and 290
Graphical analysis The arc shape depends on temperatures (dust top, ground, dust vertical extension) and The arc shape depends on efficiencies (dust composition, size, shape) The dip in the curve depends on relative weights of efficiencies at 10.8 and 12.0 µm Dust column to the ground Arc sensitivity to increasing... (Tg=310, Td=290) Dust top temperature Ch 9-Ch10 (Tg=295, Td=270) Scattering or absorption efficiencies at 12.0 µm Ground temperature (Tg=310, Td=270) Scattering or absorption efficiencies at 10.8 µm Channel10 BT
Dust (Td) and ground (Tg) temperatures estimates Tg=302 Tg=318 Td=276 Td=272 Real (blue dots, right h.s.) compared with simulated (green-red dots left h.s. and lines) scatterograms based on Tg=318 Td=272 Σ11=0.6, 0.3 Σ12=0.2, 0.25 Dust column down to 50% of that temperature difference Smaller arcs, higher in the scatterogram, indicate less temperature contrast (Tg – Td) AOT=0.3 0.6 2.0 1.0 1.3
IR model operation Ch10 BT Initial Td Td T0 Initial T0 b a Max T10 in neighbours Ch 9-Ch10 BTD Min T10 in neighbours Min difference If slope=b, refresh T0 If slope=a, refresh Td
Decision tree yes no Subjective verification against masks, images and news media: Done Verification from other sources (AERONET, LIDAR): In progress Inter-comparison with other methods (Solar): Not started
Graphical validation threshold ch9-ch10 < -1.3K AOT =2.8, too strong depth Due to location of minimum threshold NOT < -1.3K AOT not calculated threshold ch9-ch10 < -1.3K AOT =1.7, strong depth
Applicable to volcano ash • Model results are quite different from the RGB visual impressions, and add information in RGB non-pink areas with small dust depth • No direct comparison with mass loading without ash density estimate Dust RGB 2010-05-08 12UTC Icelandic ash Optical thickness, retrieved from IR courtesy of F Prata
Ground versus dust skill Dust Rock IR model does not usually pick on rock or sand areas Sandy ground 21Mar2010 12UTC Meteosat-9 The IR model separates the dust areas from the ground dry areas
Model fails for atmospheric inversions • Occasionally, during night, thermal inversions duct dust at high speed • Due to the thickness, no negative 10.8µm – 12 µm difference appears above the dust • However, negative differences appear over clear ground
Dust RGB Green= [-15K (8.7-10.8)µm..0K]=NoGreen Red= [-2K (10.8-12.0)µm ...4K]=NoRed 2010-03-21 12UTC, Saharian region NoBlue= [261K (10.8µm) ...289K]=Blue • Magenta areas are typically dusty: neither necessary nor sufficient condition • Inside magenta areas, darker (less green) pixels show a smaller difference c7-c9 which means higher AOD • The threshold in the red component (-2K) is exceeded in large areas of the dust storms. • Blue component is most of the time saturated over desert areas during day.
The cloud-to-dust spiral in the differences diagram 1 4 2 9 4 3 3 2 1 2004-05-13 13:00 UTC, 10.8 µm 1: Thick high cloud 2: Broken low cloud 3: Ground, drier air towards 4 4: Dust cloud
RGB compared with the IR-MODEL IR-MODEL discriminates significantly several (>4) levels of AOD RGB discriminates <4 levels Pinkness is not a direct measurement of AOD for high AOD BT7-BT9 (pinkness) Reduced ground temperature under the thicker layer of dust AOD
Channel versus model parameter: correlations Tg - Td AOD Correlations are stronger for AOD > 2 Ch9 strength (compared with the other channels) is not a good indication of AOD Ch7 – Ch9 is a better indication of AOD, still poor The thermal deficit retrieved by the model is reverse-correlated to AOD AOD C7-C9, pinkness C9 strenght AOD
Contents • Infrared dust properties • Where you learn how cool dust really is • A model of atmospheric dust • Where you learn to distinguish high thin from low fat • Validation via AERONET • Where you learn that models can help your eyes • Mixed scenes: cloud and dust • Where you learn that life is impossible without water • Conclusions • Where you learn that there is more dust on books than books on dust
5.52E 22.77N, model on image: theta=0.16 40C-47C size=31 12.02E 13.22N, model on image at 12UTC: theta=0.6 31C-39C size=29 2.66E 13.53 N, model on image: theta=0.8 33C-42C size=14 -5.94E 13.28N, model on image: theta=1.9, 31C-42C
Validation based on ground measurements(AOD units) AEROMETIR-MODEL • 0.9 0.6 31-39 C 29 µm • 0.35 0.2 40-47 C 31 µm • 2.1 1.9 31-42 C • 1.6 0.8 33-42 C 14 µm • 0.4 NO DUST (too uniform) • 0.1 NO DUST • 1.7 2.6 30-38 C • 0.03 NO DUST IR-MODEL is too sensitive to temperature at the arc minimum AOD AOD Ch7-Ch9 = PINK Ch9-Ch10
SAMPLE VALIDATION • based on AERONET ground measurements • Good agreement (+/- 30%) over desert grounds • Over the ocean or islands, lack of model sensitivity due to insufficient temperature contrast, dust thinness or uniform background for neighbour calculation • Better match for coarse than for fine aerosol • No sample validation done so far for dust temperatures (heights), using ground temperature. This is essential for evaluation of the thermal deficit
Other validation source: Nowcasting SAF dust flag • For the ocean, day time: R1.6/R0.6 high, T12.0-T10.8 high, SD(T10.8-T3.9) smooth • For the ocean, night time: same IR, T8.7-T10.8 high • For continental surfaces, day time: not cold T10.8, smooth T10.8, filters for cloud Nowcasting SAF dust flag and Dust RGB 21-Mar-2010 12 UTC
Contents • Infrared dust properties • Where you learn how cool dust really is • A model of atmospheric dust • Where you learn to distinguish high thin from low fat • Validation via AERONET • Where you learn that models can help your eyes • Mixed scenes: cloud and dust • Where you learn that dust tends to soak • Conclusions • Where you learn that there is more dust on books than books on dust
Low level dust forming a dust wall in Niamey (courtesy of E. Kploguede)
Dust-cloud interaction 2008-03-23 11:30 UTC Meteosat Ch9 Land with different emissivities Dust over sea Ice cloud Dust over ground What is the ice temperature at the cloud boundaries? 265 K 275 K 285 K Dust over ground Dust over sea Ice cloud Land with different emissivities
Value added by the channel 8.7µm Real (left h.s.) compared with simulated (right h.s.) scatterograms based on Tg=308 Td=266 Σ8.7=.35, .2 Σ11=.6, .3 Σ12=.2, .25 and ground emissivity 85% at 8.7µm Marks at optical-thickness third-units from the right ends 7-9 More emissive ground at 8.7µm 7-9 9-10 9-10 Less emissive branch
Dust-cloud interaction Cloud-dust index: 2*ch9 – ch7 – ch10
Contents • Infrared dust properties • Where you learn how cool dust really is • A model of atmospheric dust • Where you learn to distinguish high thin from low fat • Validation via AERONET • Where you learn that models can help your eyes • Mixed scenes: cloud and dust • Where you learn that life is impossible without water • Conclusions • Where you learn that there is more dust on books than books on dust
Conclusions • A model based on three infrared window channels provides a set of parameters for dust storm severity • Tdust, Tground and Depth values are essentially derived from 10.8µm and 12µm • Channel at 8.7µm provides refinement at the dust end of the curves. Not at the ground branch, due to uncertain ground emissivity • The model validation against AERONET is satisfactory, but other validation tools (NWCSAF, LIDAR) are needed
Outlook • A pattern for surface cooling by dust and particle size profiles will improve the simulation of the observed radiances • Particle size affects channel emissivity in a way to be learnt, usable to reduce the gap between expected and real radiances (residuals) • Looking into the BT’s for dust mixed with water or ice will clarify the role of aerosols in cooling the atmosphere and inhibiting rain (or hurricanes!). • Coupling IR technique with existing methods for solar channels will allow the simultaneous retrieval of surface albedo and aerosol optical depth • A calibration against the solar technique will provide skill for the IR estimate, even during the night
THANKS FOR YOUR ATTENTION ! • List of referred events: • 2004-05-13 12:00, Sudan and Saudi Arabia • 2008-02-02 06:00, Saudi Arabia • 2008-03-23 12:00, Libya • 2009-03-28 18:00, Argentina Fish Cross-over
Can you not think of a question?Just choose one from the following:1. Why do you see “pink” areas in southern Africa frequently? Is there a diurnal temperature cycle?2. What can we do in case of thermal inversions? Do channel diagrams help identify those situations?3. How can we produce the scatterograms by ourselves?