Download

1 / 64
640 likes | 641 Vues
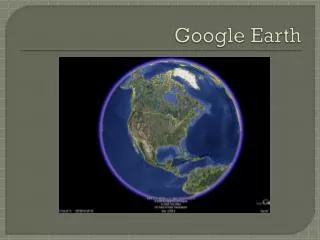
An Introduction to ARCGIS 9 and Google Earth for Earth Scientists. COORDINATE SYSTEMS LAT-LONG / UTM. How do we represent a curved surface as a flat surface?.

E N D
An Introduction to ARCGIS 9 and Google Earth for Earth Scientists
COORDINATE SYSTEMS LAT-LONG / UTM
How do we represent a curved surface as a flat surface?
A record must be kept of the coordinate systems associated with both the data set and the data frame in which the data is to be plotted. If they are different, ArcGIS will automatically convert the data set coordinate values to that of the data frame. It must however be told what the data set and data frame coordinate systems are
What are data sources in ArcGiS ?
ArcGIS map document files have the extension .mxd. An .mxd file is composed of layers ('events') that contain information about the symbol, its colour and size, and the path of the source .dbf file containing the x-y coordinate information of the plotted 'features' (e.g. points). This information can also be retained in independent .lyr files. In this sense .lyr files are segmented parts of the .mxd file, and can be transferred to a new mxd file. A .lyr file will however only load correctly into a new document if the original path to the .dbf file still exists. For instance, if the name of the folder containing the .lyr file is modified or changed, synchronisation will be lost between the .mxd and source .dbf files. Once a .lyr file has been loaded and the .mxd file saved, the .lyr file can be deleted. (A layer can also be repeated in the same document, or transferred to another document, using ‘Copy’ and ‘Paste’.) The source of any layer can be found in ‘Data Source’ in the Source tab of the ‘Layer Properties’ of the layer. On the other hand a .shp file and its associated files contain all the information pertaining to any given layer, and they can be loaded into another document or computer independent of the existence or location of the original data source.
What does ArcGIS say about Layers and Shape files. Layer - In ArcGIS, a reference to a data source, such as a shapefile, coverage, geodatabase feature class, or raster, that defines how the data should be symbolized on a map. Layers can also define additional properties, such as which features from the data source are included. Layers can be stored in map documents (.mxd) or saved individually as layer files (.lyr). Layers are conceptually similar to themes in ArcView 3.x. Shapefile - A vector data storage format for storing the location, shape, and attributes of geographic features. A shapefile is stored in a set of related files and contains one feature class.
What are Feature Classes in ArcGiS ?
What will we do in the practical exercise? 1) Set up a working directory (e.g. arcchatham) to include the following folders: Airphoto - for airphoto or landsat, etc., images, Excel - for EXCEL (.XLS and .DBF) and ExpertGPS (.gpx) files, including the .xls masterfile. rectify - for rectified images. shape - for ArcGIS shapefiles. layer - for ArcGIS layers. ref_pnts - for reference points used to georegister any airphotos that need to be georegistered. 2) Add the EXCEL .dbf data file to the ARC MAP document, and create outcrop number labels for the data points.
THE STRUCTURE OF THE EXCEL .DBF FILE In the Excel master file the data is organized as a set of fields (columns) grouped into a set of Tables. The Table and Field order might be for example: STATI: Statnum, UTMX, UTMY, UTMZ, Long, Lat, Elevation, Statype, Travnum, Geologist, Airphoto, Outcrop, Sketch/Photo, Comment, and UTM Zone. STRUCTURE: Statnum, UTMX, UTMY, STRUCFEATURE, Azimuth, Dip, Top direction TRAVERSE: Statnum, NTS Map, Field dates, Summary LITHOLOGY: Statnum, Rock #, Rock Type, Metals, Weathered colour, Fresh Colour, Describe, Comments SAMPLE: etc
WHAT YOU NEED TO DO BEFORE SAVING THE .dbf FILE Carry out a Format ‑> Column ‑> Autofit on the columns and save the file as an XLS file. While the first row of the database may contain the field titles, delete any other rows above the field title row and make sure that all the records in any given column are of the same type. Save the modified file as, e.g. 'chatham.dbf'.
ARCMAP ESSENTIAL PROCEDURES : Airphotographs are added using the ‘ADD’ tool. The EXCEL database is added as an ‘…..Event’ layer using the ‘Add XYdata’ tool. Symbols (waypoints, bedding, foliation, joints, dikes, etc) are added by copying and pasting the first event layer, and modifying its properties, or by repeating the 'Add Xydata' process. Pre-existing .lyr layers can also be imported into the document.
THE ARCGIS INTERFACE: MENU BAR & TOOL BARS, TABLE OF CONTENTS, DISPLAY AREA, AND STATUS BAR
The map shown in the display area contains: the data frames, which in turn contain: the layers, which in turn contain: the data features. Note that the map may contain several data frames.
ADDING AIRPHOTO IMAGES TO ARCMAP Once ARCMAP is loaded, optionally change the name of the data frame from 'Layers' to a recognizable name such as 'Chatham'. DC the Layer icon in the TOC to get the 'Data Frame Properties'. Click the tab 'Coordinate System' ‑> Predefined ‑> 'Projected Coordinate systems' to set the coordinate system to WGS84 UTM zone 17N. Click APPLY and OK. Click the ADD icon, select the name of the georeferenced aerial photo to be loaded (e.g. chatham2tif, and click ADD (or drag and drop the airphoto shapefile from the ARCGIS CATALOG).
Arc Catalog is an application that allows you to examine the properties of all files used in ArcGIS, and to create blank layer or shape files for use in creating line and polygon feature layers.
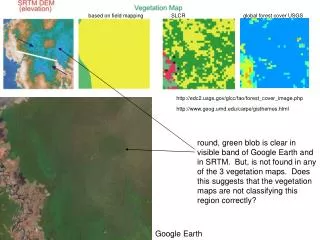
What if the image is too dark?, e.g. a landsat image from Geogratis. Properties -> Symbology -> Histogram Equalize What if the image is not georeferenced? i.e. NOT a .geotiff or MrSid, but an image derived from Google Earth? What if the image is too large?
TO PRINT THE AIRPHOTO WITH A GRID AND TO SCALE ON 11 X 8.5 PAPER DC 'Layers' in the TOC to get the DATA FRAME PROPERTIES. Click the GRIDS tab ‑> New Grid ‑> Measured Grid -> Next and follow the subsequent instructions to set up the grid according to your requirements. In DATA FRAME PROPERTIES select 'Data Frame’ and in 'Extent' change 'Automatic' to 'Fixed Scale', adding a value of 1: 10000. Click the Layout View icon (or View -> Layout View) to enter Layout View. The image can be moved within the limits of the 11 x 8.5 inch page by using the PAN tool.
LOADING A .DBF FILE AND PLOTTING STATION SYMBOLS AND LABELS Load ARC Map and the relevant document, and in 'Tools' ‑> 'Add X Y data' and in 'Add XY data' browse and select 'seismic_loc.dbf'. Specify Longitude and Latitude as the X and Y coordinates, respectively, and indicate the coordinate system to be used by clicking the Edit button ‑> Select ‑> Geographic Coordinate systems ‑> World – WGS84. Click ADD, then Apply and OK. 'Chatham Events' will appear in the TOC. Change the name to e.g. Stations
ADDING A LABEL To add an 'Outcrop number' as a label, DC the layer name in the TOC to get the 'Layer Properties'. Select 'Labels' ‑> check the 'Label features’ in this layer box ‑> select 'Label all the features the same way' as the 'Method' ‑> select YEAR as the 'Text String Label Field' In the Placement Properties option box select low for 'Label Weight' and check 'Place overlapping labels'. Click APPLY and then OK if the plot is satisfactory.
Stage 2 Creating a shape file and image layer from ‘chatham events’ RC ‘stations' and select DATA ‑> Export data.
Export the file as 'year.shp' to \chatham\shape. When asked “Do you want to add the exported data to the map as a layer, answer ‘YES’. ‘year’ will now appear in the Table of Contents (TOC), along with stations. You can now apply a new set of attributes, e.g. symbol, colour, label - to the new year layer. The shapefile that has been created can be exported under a different name and added as a new layer as many times as you like.
SETTING THE REFERENCE SCALE Double click the ‘chatham’ layer or RC the image to get the ’Data Frame Properties', and enter 'none' as the value in 'Reference scale'. The plotted symbols will now remain the same size no matter the scale of the image. The symbol size will be that set in the 'Symbol Selector' (LC the relevant symbol in the TOC to get to the 'Symbol Selector'). Now RC the image (not the symbols) -> Data Frame Properties and then 'Reference Scale' ‑> 'Set Reference Scale'. The reference scale will be set to the current scale of the image. Now as you change the scale of the image, the size of the symbols changes; zoom in and the symbols will get larger. To revert to the original size of the symbols, RC the image and press the 'S' key twice.
Stage 3 PLOTTING STRUCTURAL DATA: CREATING .SHP FILES Re-load ArcGIS and bring in campus.mxd in c:\arc_campus RC one of the layers (Events) and select DATA ‑> Export data. Export any of the layers as c:\arcampus\shape\'bedding.shp'. When asked “Do you want to add the exported data to the map as a layer, answer ‘YES’. Alternatively, ADD the stati.shp file as a new layer, change its name to e.g. ‘Bedding”. Repeat to create .shp files for 'foliation1', foliation2, etc, and 'trap_dikes', or any other structural feature in the 'campus.dbf' file.
GROUPING THE STRUCTURAL LAYERS The various structural layers can be grouped as a 'Structure Layers' Group by right clicking 'Layers' in the TOC and selecting 'New Group Layer'. Click and drag the layers into the Group layer. Turning off the Group Layer will turn off all the structure layers even if they are turned on individually.
PLOTTING ORIENTED SYMBOLS DC 'bedding' to get 'Layer Properties'. Select Symbiology ‑> Categories ‑> Unique values. In the values field select STRUCFEATU . Unselect the ‘All other values’ check box, click the ‘Add Value’ button and add the value 'subd' to the box. Double click the symbol that appears to the left of 'subed' to get to the Symbol Selector. Click 'More Symbols' and click Geology 24K. Select the symbol to represent bedding and in the options box select size (40) and colour (orange) and make sure the angle is set to 270. Click OK. In 'Layer Properties' click 'Advanced' ‑> rotation ‑> check the Geographic radio button, and in 'Rotate Points by angle...' select AZIMUTH. Click APPLY. Click OK and OK. Repeat for 'foliation1', ‘foliation2’. 'dikes1, dikes 2', and faults.
PLOTTING STRUCTURAL LABELS In 'Layer Properties' select Labels. Check the 'Label features in this layer' box. In 'Method' select 'Define classes of features and label each class differently'. In 'Class' select 'Get Symbol classes' to have the class value 'subed' entered as the class, and check 'Label features in this class. Enter 'DIP' as the Label Feld, and in the Placement Properties option box select low for 'Label Weight' and check 'Place overlapping labels'. Repeat for 'foliation1', ‘foliation2’. 'dikes1, dikes 2', and faults.
Stage 4 • Creating a polygon map DRAWING LINES (GEOLOGICAL BOUNDARIES) RC 'Layers' and 'Add a New Group'. Call it ‘Lines'. Click the ArcCatalog icon in the Toolbar (icon to the left of the red 'Arc Toolbox' icon. Click File ‑> New ‑> Shapefile. Give the Shapefile the name ‘all_lines’, select the feature type as 'Polyline', and set the coordinate system.( If you intend to use the ET Geowizards function to convert intersecting polylines to polygons you must set the Coordinate system in all shapefiles to be added to ArcMap (ET Geowizards will not assume that the shapefile has the coordinate reference of the Data Frame.)
SAVING THE ‘SPATIAL REFERENCE’ It is convenient therefore to place the current coordinate project file in the Coordinate Systems folder in \Program Files\ArcGIS ‑ when creating your first or any shapefile (Catalog ‑> File ‑> New ‑> Shapefile) and when adding the 'Spatial Reference', save the selected coordinate system to C:\Program Files\ArcGIS\Coordinate Systems. When adding another shape file the 'Spatial Reference' can then be easily retrieved with the Select button.) Click OK. The new ‘all_lines’ shapefile will appear in the shapefile list in the catalog. Click and drag the shapefile into the 'Lines' group in the TOC.
DRAWING LINES To draw lines click View in the Main Menu Toolbar -> Toolbars and check the Editor option. The Editor toolbar will appear amongst the toobars at the top of the screen. In the Editor selection menu click ‘Start Editing’. In the Start Editing window select which folder you wish to edit data from, and then click OK. On the Editor toolbar select ‘Create new feature’ in the Task menu, and ‘Lines’ in the ‘Target’ selection menu. Draw lines with the Sketch Tool (the pencil icon; the arrowhead next to the pencil is the Feature selection tool); double click to terminate drawing of the line. (To remove lines use the keyboard delete key.). (Note: the drawing tools in the Draw toolbar are used to draw in Data View or Layout View, and are not related to any shapefile or layer.) Lines can be edited using the ‘Modify Feature’ Task tool. When finished drawing lines, click ‘Save Edits’ and ‘Stop Editing’.
CONVERTING LINES TO POLYGONS AND TRANSFERRING SELECTED POLYGONS TO THEIR OWN LAYERS Download ET Geowizards http://www.ian‑ko.com/ ‑ ET Geo Wizards http://www.ian‑ko.com/ET_GeoWizards/UserGuide/et_geowizards_userguide.htm ‑ ET Geo Wizards online guide Unzip ETGeoWizardsXX.zip ‑ the file contains a single executableRun ETGeoWizardsXX.exe ‑ a simple installation wizard will guide you through the process. The best location to install the files is the hard disk where ArcGIS resides or your system disk.
How to install ETGeoWizards In ArcMap Click the Tools menu and click Customize. Click Add from file button. Navigate to the folder where ETGeoWizards941_9x.dll resides, select it and click open. In the added objects dialog box there will be a single object ‑ ETGeoWizards. Click OK Click the Commands Tab. There will be new category ‑ ET GeoWizards ‑ click on itand drag the ET GeoWizards command to the Tool Bar.
Prepare a set of Lithology shape files Create a Lithology group and a set of lithologic shape files e.g. a 'granite' polygon shape file; add the shape files to the Lithology group.
How to create a set of polygons from the Lines layer Click ET Geowizards in the tool bar, and in the Geowizards menu select Polygon -> Build Polygon -> Go -> select the all_lines layer as the input and in “Specify output feature class or shapefile” enter c:\???\shape\allpolygons (where ??? is a predefined relevant folder) as the destination file. Make sure the option to ‘clean’ the polylines is selected. Click Finish to initiate the convertion
How to create a set of individual polygon layers With the 'allpolygons' layer active, start the Editor, and in Start Editing select the folder you want to edit. In 'Task' selection list select 'Create New Feature’, and in 'Target' select the e.g. granite shapefile. Click the polygon to be copied to the relevant layer (use Shift select to choose several polygons). RC and select Copy. RC and then Paste. Select ‘Save Edits’ and ‘Stop Editing’. A copy of the selected polygon(s) representing granite bodies will now appear in the granite shape file. To make the filled polygons transparent: RC Tools -> Effects -> indicate which layer you wish to make transparent, click the ‘Adjust Transparency’ icon, and adjust the transparency.