Download
1 / 40
420 likes | 523 Vues
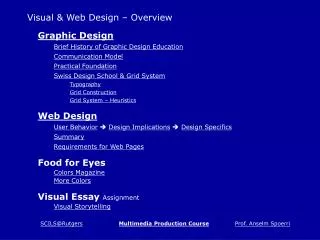
Information design and visualization: The graphic system. Dr. Lily Díaz Professor Media Lab, School of Art and Design Aalto University January 18-19, 2012. Knowledge. A process of approximation Organization of memory

E N D
Information design and visualization: The graphic system Dr. Lily Díaz Professor Media Lab, School of Art and Design Aalto University January 18-19, 2012
Knowledge • A process of approximation • Organization of memory • Inner cognitive process augmented by technology and social organization.
3 types of interdependent knowledge • Declarative • Meaning • Procedural
Graphic systems of representation • Monosemic - information is represented through the use of signs whose meaning has been defined beforehand. • Polysemic - the meaning of the individual signs follows and is deduced from considerations of the collection of signs.
Information design • Makes use of visual and spatial cognitive features of human perception. • Makes use of representation to codify knowledge. • Involves a reduction and translation in order to make knowledge understandable.
Information • “Information is the difference that makes a difference…” Gregory Bateson.
Low-level feature analysis • Visual area 1, or V1 – Primary visual cortex, a kind of tapestry of interlocking regions where different kinds of information are processed. • Visual area 2, or V2 – Receives input from V1 and responds to slightly more complex patterns, based on the processing already done in V1. • Visual area 3, or V 3 – Contour extraction mechanisms. • Visual area 4, or V 4 – Pattern perception, association through grouping based on proximity.
Top down processing • Natural semantics – permeate our spoken and conceptual language. • Ex: George Lakoff argues that spatial metaphors are not just ways of making language more vivid but are fundamental to communication and reasoning.
Graphics • Graphics uses the properties of the visual image in order to make relationships of difference/similarity, order or proportion appear among data. • Graphics is applied to a set of data after it has been defined as ‘the table of data’. • Graphics is about processing data for understanding and extracting information in order to communicate something.
Reduction and synthesis • Process involves a selection of the proper elements in order to express a thought or idea. • Not everything can be included. • A graphic is supposed to ‘reveal’ something about the information it represents.
Translation • Re-structuring and imposition of order. • Content is codified using diverse forms of graphic representation. • Hierarchy • Matrix • Network
System of graphic representation(Processes) • Content • Form
Content • “…those elements of the thought which can remain constant, regardless of the sign-system used for their transfer”
Form • is the ‘container’ of the content
System of graphic representation(Elements) • Positional variables • Variations of the signs • Planar dimensions • Retinal variables • Perception • Relation • Identifiers • External • Internal
Positional variables • Variations of the signs • Point: represents a spatial location in time. • Line: has measurable length but no area. • Area: has measurable size and can vary in position, value, texture, and color.
Positional variables • Planar dimensions • height = y • length = x.
Retinal variables • Size: allows differentiation through magnitude. • Value: allows differentiation by using the scale between black and white. • Texture: allows differentiation by using different arrangement of signs. • Color: allows differentiation through distinction of colored sensations. • Orientation: allows differentiation by using different orientations for a line or line pattern. • Shape: allows differentiation by changing the shape of a sign of constant size.
Visual patterns can be used to express relations From Colin Ware’s Visual Thinking for Design
Meaning can be encoded in graphics From Colin Ware’s Visual Thinking for Design
Metaphors can be expressed visually From Colin Ware’s Visual Thinking for Design
Identifiers • Title is an external component • Independent of the graphic representation. • Extremely important since by itself a drawing cannot furnish all the elements necessary for identification. • Allows us to correctly identify the invariant and all the components. • Legend is an internal component • enables us to identify how visual variables are used to represent each the components
Title as external components • A name can operate as a linguistic form of memory. • Evoking • Linking place with events or people. • Magnifying glass • Placing emphasis on certain aspects of a phenomenon, while ignoring others.
Internal components • Components: Have length and can be classified • Elements • Objects • Classes • Categories.
Data for internal components From Jacques Bertin, The Semiology of Graphics
Graphic rendering From Jacques Bertin, The Semiology of Graphics