Download
1 / 50
500 likes | 702 Vues
Gary Keough, State Statistician USDA National Agricultural Statistics Service New England Field Office. United States Department of Agriculture National Agricultural Statistics Service. Trends in Maine Agriculture a summary of the 2012 Census of Agriculture. CENSUS OF AGRICULTURE.

E N D
Gary Keough, State Statistician USDA National Agricultural Statistics Service New England Field Office United States Department of Agriculture National Agricultural Statistics Service Trends in Maine Agriculture a summary of the 2012 Census of Agriculture
CENSUS OF AGRICULTURE A complete count, taken every five years, of America’s farms and ranches and the people who operate them.
“FARM” DEFINED Any place from which $1,000 of agricultural products were produced and sold, or normally would have been sold, during the Census year.
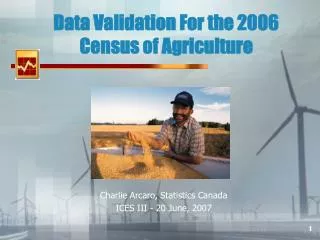
2012 DATA COLLECTION • NASS mailed questionnaires for the 2012 Census of Agriculture to farm and ranch operators in late December 2012 to collect data for the 2012 calendar year. • Completed forms were due by February 4, 2013. • NASS continued to collect Census data through summer 2013. • Producers returned their forms by mail or online.
Number of farms and land in farms • 8,174 farms in 2012, up slightly from 8,136 farms in 2007 • 1,455,304 acres in 2012, up from 1,347,566 acres in 2007
ECONOMICS • 2012 Total Farm Income $810.2 million, up from $661.4 million in 2007 • 2012 Total Expenses, $645.6 million, up from $493.7 million in 2007
Net Cash Farm Income Farms with total production expenses equal to market value of agricultural products sold, government payments, and farm-related income are included as farms with gains of less than $1,000.
Economic Sales Class • Farms with $500,000 sales and above totaled 244 and accounted for 3% of farms and 74% of all gross sales. • Farms with $250,000 sales and above totaled 446 and accounted for 5% of farms and 83% of all gross sales. • Farms with $100,000 sales and above totaled 785 and accounted for 10% of farms and 90% of all gross sales.
Community Supported Agriculture Maine had 406 farms with CSAs which rank 8th nationally. This is 5 percent of all farms and ranks 3rd nationally by percent of farms.
Wholesale direct to retailers and institutions • Maine had 1,074 farms that market directly to retailers which ranks 17th nationally. This is 13 percent of all farms and ranks 7th nationally by percent of farms.
DEMOGRAPHICS • Average age of the principal operator was 57.0 years compared to 56.4 years in 2007 years • 29% of principal farm operators are women, up from 25% in 2007
Principal Operator Age Group Comparisons, 2012 and 2007
Beginning Farmers Years on present farm, 2007 and 2012 Source: Census of Agriculture
Women Principal Farm Operators Average age of women principal operators was 53.3 years compared to 51.9 years in 2007 years in 2007
Percentage of Farms with Women Principal Operators,New England States and U.S., 2002, 2007, and 2012 Censuses of Agriculture
CENSUS DATA INSIGHTS • The full 2012 Census publication is certain to show interesting trends over the past five years. • It will contain several pieces of data that were collected for the first-time ever, including new information on: • biomass • Internet access • regional food marketing and distribution • land use practices, and • agroforestry.
FINDING CENSUS DATA • Census data are available: • Online at www.agcensus.usda.gov • NASS Quick Stats: http://quickstats.nass.usda.gov • Desktop Data Query tool: http://www.agcensus.usda.gov/Publications/2012/Online_Resources/Desktop_Application/
FINDING CENSUS DATA • Other Census Products: • State and County profiles: http://www.agcensus.usda.gov/Publications/2012/Online_Resources/County_Profiles/Maine/index.asp • 2012 Congressional Districts: http://www.agcensus.usda.gov/Publications/2012/Online_Resources/Congressional_District_Profiles/ • Agricultural Atlas: http://www.agcensus.usda.gov/Publications/2012/Online_Resources/Ag_Atlas_Maps/
FINDING CENSUS DATA • Other Census Products: • Special Organic Tabulation, September 2014 • Watersheds, November 2014 • Typology, December 2014
Contact info: Gary Keough USDA NASS New England Field Office 53 Pleasant St. Rm 3450 Concord, NH 03301 603-227-3129 Gary_keough@nass.usda.gov