Download
1 / 62
690 likes | 966 Vues
Value Chain Analysis and Promotion. Nongluck Suphanchaimat Department of Agricultural Economics Faculty of Agriculture Khon Kaen University nongluck@kku.ac.th. Mekong Institute, Khon Kaen Thailand 30 November 2011. Structure of the course. VC concepts

E N D
Value Chain Analysis and Promotion Nongluck Suphanchaimat Department of Agricultural Economics Faculty of Agriculture Khon Kaen University nongluck@kku.ac.th Mekong Institute, Khon Kaen Thailand 30 November 2011
Structure of the course • VC concepts • Analysis tools : Qualitative • Analysis tools : Quantitative
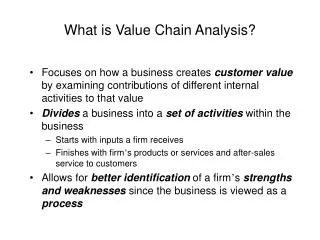
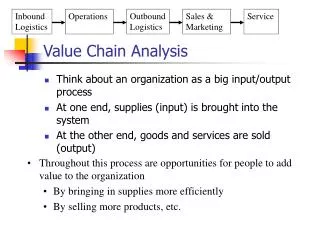
value chain Study “the full range of activities which are required to bring a product or service from conception, through the intermediary phases of production, delivery to final consumers, and final disposal after use” (Kaplinsky 1999, pg. 121).
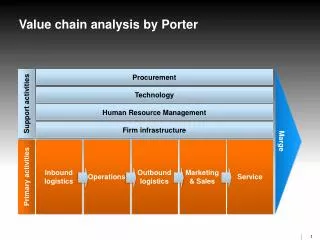
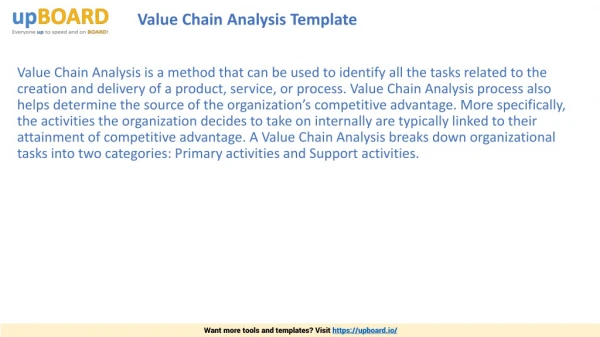
Value Chain Main Concepts Porter ( 1985 ) • Analyze primary activities and support activities. • Analyze enterprise competitiveness , product design, input procurement , logistics, marketing, sales, after sales, support service.
Value Chain Main Concepts • Analyze individual & collective. • Analyze income distribution • Analyze patterns of regulation , domestic and international market and state
Step of work • Systematically maps the actors. • Identify the distribution of benefit of actors in the chain. • Detect the source of competitive • Examine the scale of upgrading within the chain. • Highlights the scale of governance. Kaplinekey and Morris ( 2001 )
Value chain study analysis focuses on the interaction of actors along each step of the production system as well as the linkages within each set of actors. knowledge and relationships are developed to gain access to markets and suppliers the success of actors in value-adding their production lies in the ability of these actors to be part of the networks
The value system Supplier’s value chain Firm’s value chain Buyers’ value chain
Farmer/ Producers • manage • value adding • Distribution Trader/collector Processing Retailer Wholesaler Exporter Consumer Wholesaler in export market • manage • value adding • Distribution Distributor in export market Retailer in export market
How value chain analysis work better for the poor? • Improve value chain by income the total amount and value of the product that the poor sell in the chain . • To sustain share of the poor in the chain
How the study of value chain help solve problem of poverty • enhance participation of the marginal people • enhance understanding among actors
Value chain selection Mapping Value chain 1. General tools
Analyze supply chain Analyze actors’ relation Analyze opportunity to upgrade the chain 2. Analyze value chain: Qualitative approach
3. Analyze value chain: Quantitative approach Analyze cost and margin Income distribution Employment distribution
Value Chain selection byMatrix Ranking • Identify selection criteria • Weighting criteria • Rank each commodity by score 1 – 4 for each criteria Criteria Weight (Rice) (Silk) (poultry) Employment 50 % 5 3 3 market potential30% 3 2 4 social support 20% 34 1 3.62.92.7
Indicators of market potential • Product/service are in high demand • Potential to expand market • High rate of people participation • Potential for value creation
Other conditions for VC selection The study of value chain help enhance governance Environmental reasons the study of value chain help enhance gender relations.
Step of work 1. Mapping all actorsin the chain 2. Identify actors’ relations and rules 3. Study cost and returns of each actors 4. Synthesize participation of actors in value chain 5. Identify ways to improve value added of the chain eg. Governance, modify rules and regulation
How to analyze Value chain in relation to poverty reduction? • Increase participation of the poor overtime • Profit margin of the poor increase overtime
Mapping the value chain Objective of Value chain study • value chain analysis help enhance holisticunderstanding 2. Help identify constrains of the value chain • Position of thepoor in value chain 4. Illustrate actors’ interaction in the chain • Create awareness of each actors in the chain
Example : mapping actors Production Maize On farm feed consumption Domestic trader Collection Border trader - Uncrobed Trader with silo - refined Animal feed Export Manufacturers - mixing Consumption
Mapping actors Wheel sale Input Consumption Collection Production retail Production Export Village Farmers Processor Consumer Input trades Actor traders Cooperatives Exporter Bank traders Money lender central market Information
Mapping activities Farmers Cooperative Village traders Processor Consumer Exporter Collect Store transport Storage Processing Distribution packaging • - Storage consumer • Grading • Transport • Storage • packaging Growing Harvesting drying
Information Consumers exporty production trading processing input • Mature • Purity • Non-toxic • Color • Size • Moisture • Color • Size • Uniformity • Smell • Grade • Color • Taste • - Package • Product • Quality
What types of relationship and linkages exist? • Spot market relation Independent relations and price is determined by market transaction 2. Persistent network relation: relationship has been developed to certain trust level that actor believe fair price is determined, transaction can occur before price set and without formal agreement 3. Horizontal integration each actors are connected and horizontal relationship has developed eg. Social network
Mapping Relationship Farmer collector Processor Traders Consumers Exporter Cooperative Farmer
Market Modular Relational Captive Hierarchy End use Lead Firm Lead Firm Lead Firm customer Integrated Firm Turn-key supplier Relational supplier value chain price componentand material suppliers componentand material suppliers Captive suppliers suppliers Material Degree of Explicit Coordination High Low Degree of power Asymmetry
HEIRACHY CAPTIVE RELATIONAL MARKET maize Organic coffee Export crafts Cut flowers customer Integrated Firm Major buyer price suppliers suppliers suppliers Example of market classification
example of possible positions of smallholders in a value chain
Governance study of management system of the value chain in order to improve efficiency and relationships of actors in the Value chain Regulatory process Rules and regulation
Worksheet 1 1. Using selection matrix, select one commodity to study value chain which you think will help reduce poverty in your area of work . 2. Mapping actors, activities and information of the selected value chain
3. Quantitative approach Consider cost and profit of each actors and their contribution to the whole Cost : money that an actor in the VC contribute Revenue : money that an actor receive Margin : money that an actor receive minus cost Cost of entry : investment and operating cost required for an actor to enter the VC
Distribution of cost and margin : identify how cost and profit margins are currently distributed over the actors in the value chain Critical question : Can the poor increase margins in the VC? Change in cost and margin : change over time of cost and revenue (increase or decrease)
Value chain comparison : compare profits of one chain with another chain to see if it is worthwhile to change chain Performance benchmarking : compare the practice in selected VC to an industry standard “best practice” in order to improve effectiveness and efficiency of the selected chain
Cost : Financial cost Opportunity cost (1) Financial cost : monetary expense of production resources (land, labor, capital) land : rent labor : wage capital : interest
2. Opportunity cost imputed cost to the value chain actor’s time, land and capital. Opportunity cost for labor : the cost incurred if a person is employed Opportunity cost of land : the return on leasing the land to another producer. Opportunity cost of capital : the interest rate that one would receive from a bank.
Use of opportunity cost to select crop If farmer want to select second crop after rice given that family labor and water is available. Mize Saybean Sesame Mill baht for 0.5 2.7 2.6 10 ha Best choice
Calculation of cost • Investment cost are mostly cost of asset or equipment that usually require depreciation. If actor borrow money must consider : - Principal - Interest
Operational cost Fixed cost : • Salaries • Insurance • Rent • Depreciation • Interest on fixed loans
Variable costs • Wage related to production • Direct production expenses such as materials Transaction cost • Communication cost • Information cost • Legal cost to have contract check by a lawyer Regulatory cost • License • Levies • Grading service
Variable costs change with output. However some variable costs may be related to type of the product. Variable costs are easy to calculate because they change with output. However some variable costs may be related to type & quantity of the product
Fixed cost do not change with production size and fixed cost often apply to more than one product. For example vehicle cost should be shared between collection center. • Investment cost : is a certain type of fixed cost and it can be an obstacle for small – scale entrepreneur to enter and participate in a value chain. Therefore, it is necessary to lay out investment cost.
Depreciation : means the wearing out of capital goods. the firm haveto save moneyto be able to replace investment. Therefore, depreciation cost are not cash expense but it is part of the cost. “ Poor farmers and micro enterprises usually do not calculate depreciation costs”
Example of Depreciation cost calculation of an equipment 100,000 bht to be used for 5 years with salvage value5,000
Example of calculating transport cost Assume 40 m3 of space available in a truck cost $500for service charge A container of 0.2 m3 hold 8 kg of tomatoes A container of 0.4 m3 hold 10 kg of green peppers. Transport cost per kg is ($ 500 / 40 m3) x 0.2 m3) = $ 2.5 per container $ 2.5 / 8 kg = 0.3125 per kg of tomato ($ 500 / 40 m3)x 0.4 m3) = $ 5 per container 5 / 10 kg = $ 0.5 per kgof green peper
Calculating Cost on losses Assume 10% of tomato lost. This means 1 kg of tomatoes can be used at 0.9 kg. If trader buy $ 5 per kg and marketing cost is $ 2 per kg. Assume selling price is $ 8 per kg
Right The cost of tomato = $ 5 Pack & transport cost = $ 2 Total cost = $ 7 Sales revenue $ 8 x 0.9 = 7.2 Margin to trader = 0.2 Wrong Purchase price = $ 5 10% loss = $ 0.5 Pack & transport = $ 2 Total cost = $ 7.5 Sale revenue = 8 Margin = 0.5
Calculate cost at different scale Example: FC = 50,000Price = $10 /kg VC = $5 /kg)