Download

1 / 36
1.38k likes | 2.19k Vues
Root Cause Analysis. GEM. ?. Module Outline. Chronic vs. Sporadic Problems Improvement (Breakthrough) vs. Troubleshooting Addressing Chronic Problems - Breakthrough Definitions Diagnosis Why “Root Cause”? Tie to MBF (Management by Fact) Addressing Sporadic Problems - Troubleshooting

E N D
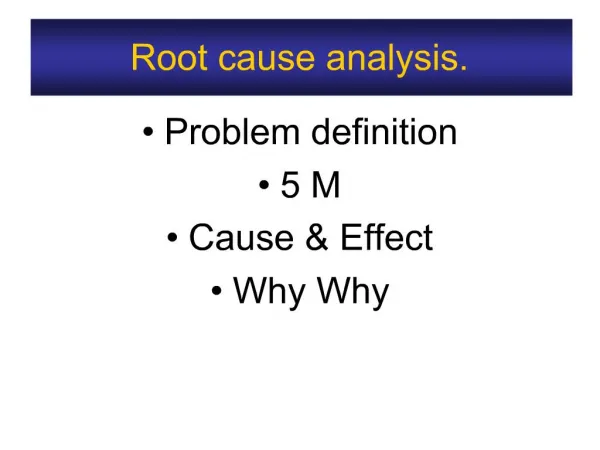
? Module Outline • Chronic vs. Sporadic Problems • Improvement (Breakthrough) vs. Troubleshooting • Addressing Chronic Problems - Breakthrough • Definitions • Diagnosis • Why “Root Cause”? • Tie to MBF (Management by Fact) • Addressing Sporadic Problems - Troubleshooting • Summary • Resources
Module Objectives • You will be able to: • Distinguish between chronic vs. sporadic problems. • Define Problem/Symptoms/Causes/Diagnosis. • Describe approaches to find root causes of chronic problems. • Describe the link between Root Cause Analysis and MBF. • Describe approaches to find root causes of sporadic problems.
Bad Performance Good Improvement vs. Fire Fighting Sporadic Gain Chronic Time
Chronic Problems • Existed for some time • Usually “lived with” or accepted • Cost more $$$$$ than sporadic problems • Don’t sound alarms (allowances for problem have been made in the system) • Competitors may be enduring same losses • Improvement is needed when a chronic problem is occurring • Requires improvement PROJECTS - investment of time and resources • Fire Prevention - attack the chronic level
Sporadic Problems • A “spike” in performance • “Alarm” usually goes off • Troubleshooting used when a sporadic problem happens (a departure from the normal level) • Aimed at restoring the status quo • May include Interim (temporary) fixes • Corrective Action - eliminate the cause of the problem • Remove the change that produced the deviation or new change to offset deviation • Fire Fighting - focus on control
Improvement vs. Troubleshooting • Improvement: Focused on attaining a new level of performance that is superior to any previous level. • Accomplished through BREAKTHROUGH. • Improves chronic level of performance. • Fire Prevention • Troubleshooting: Focused on solving a sudden change in performance. • Accomplished with CORRECTIVE • ACTION to put out a fire. • Improves sporadic level of performance. • Fire Fighting
Sequence for Breakthrough • Proving the need • Identifying Projects • Organizing project teams • Establishing project • (mission/vision/responsibilities) • Diagnosis - to find the causes • Developing remedies - based on knowledge of the causes • Proving remedies & effectiveness - under operating conditions • Dealing with resistance to change • Controlling at the new level Set-up Carry-out
Problem:Any deviation from the standard, expected, or desired which is outside the accepted tolerance, norm, or benchmark. Project:a problem scheduled for solution! Symptom:An observable indicator, cue, or event directing attention to a problem. Arising from and accompanying a problem. Theory:Unproved assertion as to reasons for the problem and symptoms. Definitions
Definitions - Continued Cause:“Something” that happened to produce a deviation of the actual from the expected or desired. Proved reason for existence of problem. Often “multiple causes”. Dominant or Root Cause:a major contributor to existence of problem which must be fixed before there is an adequate solution. Remedy:a change that can successfully eliminate or neutralize the cause of a problem.
Definition - Diagnosis • Diagnosis:the process of studying symptoms, theorizing as to causes, testing theories, and discovering causes. • Diagnosis - to find the causes • Diagnostic Journey = “symptom to cause” • Followed by Remedial Journey = “cause to remedy” • “Symptom to cause” is DIFFICULT!
Diagnosis for Improvement Diagnostic Journey: 1. Study the symptoms surrounding the problem to serve as a basis for theorizing about causes. 2. Theorize the causes of these symptoms. 3. Collect data and do analysis to test the theories and determine the causes. When the problem can be switched on & off at will - the journey is over!
Studying Symptoms • Two forms of “Evidence”: • 1. Words/documentation describing problem • 2. Physical measurements & analysis of product/process • Agreement on “terms/descriptions” for symptoms • Recording data - established to test specific theories • Quantifying symptoms: • Frequency • Intensity • Use of Pareto Charts/Analysis
Check Sheets Concentration Diagram “Autopsies” Problem Order 1 Order 2 Order 3 Total Scratches IIII II II IIII I 15 Runs IIII IIII IIII IIII IIII I IIII IIII 34 Dirt IIII I IIII 11 Wrong Color IIII I I 7 Paint Peeling I I 2 Total 32 15 22 69 Tools for Symptoms • “Glossaries” for symptom terms • Pareto Analysis Check Sheet Example:
Theorizing Causes • Diagnosis is made theory by theory • Need to affirm or deny the validity of theories • This is “IDENTIFYING POTENTIAL CAUSES” • 3 Steps • 1. Generate Theories • e.g. Brainstorm, Ask Why 5 times • 2. Arrangement of Theories • e.g. Matrix, Tables, Cause & Effect Diagrams • 3. Choosing Theories to be Tested • e.g. Data Collection, Pareto Analysis • Establish Priorities for testing theories
Ask Why 5+ times Brainstorming* Cause & Effect Diagrams* Force Field Analysis* Affinity Diagram* Structure Tree Diagram* Interrelationship Digraph* Program Decision Process Chart (PDPC)* Matrix Diagram* Check Sheet* Pareto Analysis* Designed Experiments ETC. Tools for Theorizing Causes Pareto Chart Example: * Included in Memory Jogger II
Failures from Supplier A are 2X the industry average. Why? There is excessive damage in transit. Why? Packaging is insufficient. Why? Packaging specifications are incomplete. Why? There are no technical specifications for packaging available. Why? Real Root Cause Tool Example - Ask Why 5 Times Generate Theory: Follow with Remedy!
Materials Machinery Capability Cutting oil Bar Stock cpk Tolerances Wrong Oil Wrong Material Over Sized Scheduling Packaging Part Problem Print Not Manufacturable Inaccurate Training Cost Engineering Support Procedures Operator Errors Inaccurate Maintenance Out of Date Set-up Adjustments Manpower Methods Tool Example - Cause & Effect Generate Theory: Follow with Test of Theories based on priorities
Guide Operator Crimp makes inadequate contact Thread Cross Thread Material Elbow Failures Pin not fully seated Methods Lack of Verification for Alignment Cable not fully seated Tools & Equipment # of Revolutions not counted Defective Elbow Tool Example - Structure Tree Most Likely Root Causes Problem Subproblems Theories
Testing Theories to Find Cause • Determine which cause is ROOT cause • Identifying most likely cause • DATA COLLECTION & ANALYSIS! • Methods • 1. Product/Process “Dissection” • e.g. Flow Map, Process Capability Study, Time to Time • 2. Collecting New Data • e.g. Measuring within the process • 3. Experiments - create & process trials to test validity • e.g. Designed experiments, pilots, trials • 4. Measure for Diagnosis • e.g. Variables vs. attributes, increase precision, new methods
Tools for Testing Theories • Historical Review • Flow Diagram/Map* • Process Capability Analysis • Time to Time Analysis • Stream to Stream Analysis • Histograms* • Control Charts* • Piece to Piece Analysis • Within Piece to Piece Analysis • Multi-Vari Analysis • Check Sheet* • Pareto Analysis* • Designed Experiments • Correlation Studies • Measurements within process • Study of Work Methods • Measurement Capability Studies • ETC. * Included in Memory Jogger II
Tool Example - Histogram & Run Chart Test Theory: Run Charts: Histograms: Follow with Remedy!
= + + + Total Machine Cavity Time Sample Tool Example - Capability Test Theory: - Structured Experimentation • Goal: Collect data on all parts of the process so that: • Capture all contributors to variability • Variability can be partitioned into parts due to each contributor Follow with Remedy!
Diagnosis of Failures in Systems • Historical Review - objective to improve segment of system used to attain quality • e.g.: Product Development, Supplier Relations • Based on analysis of # of past problems • Interview and Document: • 1. Brief description of problem • 2. Stage where problem 1st observed • 3. Earliest stage at which problem COULD have been discovered • 4. Reasons for NOT discovering problem at earlier stage • 5. What could have been done to have found the problem earlier or avoided it completely
Diagnosis of Failures in Systems • Examples: • 1. Historical review of past product development problems: • Symptoms & Cause: Review revealed use of FMEA/FMECA (Failure Mode, Effect, and Criticality Analysis) would have identified problems upfront. • Remedy: Require FMEA upfront for new products. • 2. Historical review of manufacturing defects: • Symptoms & Cause: Review revealed lack of set-up procedure led to high lot to lot variation and defects. • Remedy: Document and implement set-up procedure.
Diagnostic Journey Root Cause Analysis Begins with Collecting Data on Symptoms Ends with agreement on Cause(s)
What is MBF Used For? • Address gaps in business performance • Customer Satisfaction • Employee Satisfaction • Business models • Operational processes • Manufacturing processes • Simplify reporting • Link problems and root causes with action and results • Link a reporting format to a problem solving model • Report on projects that address a specific problem
Policy Deployment & Management by Fact Policy Deployment Direction Setting Direction Deployment Management Process No Yes Monitor Performance Gap Detected Management by Fact (MBF) Root Cause Analysis Diagnosis Remedies
2. Root Cause Categorization / Analysis (RCA) Analyze Problem 2 • Separate “beliefs” from “real” problem • Determine, categorize, and analyze Root Causes • Use basic quality tools • Cause and Effect Diagram • Affinity diagram • Ask “WHY” 5 times
PROBLEM STATEMENT/OBJECTIVES & PERFORMANCE TRENDS: (indicate a brief statement of fact here) Insert graph of performance over time here (e.g., Pareto Chart / Current State vs. Goal) Insert graph of more detailed information here (Supportive Info. as necessary - e.g., Costs associated with the problem statement) MBF Form Root Cause Analysis/Diagnosis Remedies
Troubleshooting • Diagnosis & remedial action applied to sporadic problems • Generally receives immediate attention • Result of adverse change • Similar to chronic problem journey, but often simpler • Journey is discovering what the change was and removing or adjusting for it • Journey: Symptom to Cause to Remedy • If troubleshooting is ineffective, the result will not be maintained
Troubleshooting • Ask: What, Where, When, How Much, Who • Compare Good vs. Bad, time to time, ETC. • Ask what “IS & IS NOT” • Reconstruct time sequence • Take corrective action to remedy the problem • Use a structured approach: • 1. State deviation. • 2. Specify the deviation (is & is not, what, where, etc.). • 3. Identify unique characteristics of deviation. • 4. Search for changes. • 5. Develop possible causes. • 6. Test the possible causes against the requirement. • 7. Verify the cause (duplicate or eliminate by removing cause).
Summary • Need to distinguish between sporadic & chronic problems • Need to be persistent - get to root cause! • For chronic problems: • Use BREAKTHROUGH • Use Root Cause Analysis (Diagnosis) • For sporadic problems - use Troubleshooting • Improvement requires use of multiple quality tools! • To find true (root) causes you need to be a: • Doctor • Detective • Driver • Gardner • Firefighter
Books (+ many others): “Quality Planning and Analysis”, J. M. Juran & Frank M. Gryna, Third Edition, McGraw Hill. “Juran’s Quality Control Handbook” 4th Edition, McGraw Hill. The Memory Jogger II, Michael Brassard & Diane Ritter, GOAL/QPC, 1994. Analytic Trouble Shooting, Kepner Tregoe, 3rd Edition, 1978, Princeton Research Press KEDC Classes Basic Quality Concepts (6430), MBF Training, Analytical Processes Resources: Barb Pociatek, GEM Quality Local Quality Engineer, QIF, or Black Belt References
Next “Quality Tools” Session • MRPII Thursday, October 28, 1999 11:30 AM-12:30 PM Elmgrove Auditorium 3rd Floor, Building 1 • Please fill out survey form before you leave.