Download
1 / 38
380 likes | 390 Vues
Group Analysis. File: afni24_GroupAna.pdf. Gang Chen SSCC/NIMH/NIH/DHHS/USA/Earth. Program List 3dttest++ ( GLM: one-, two-sample, paired t , between-subjects variables ) 3dMVM (generic AN(C)OVA) 3dLME ( sophisticated cases: missing data, within-subject covariates )

E N D
Group Analysis File:afni24_GroupAna.pdf Gang Chen SSCC/NIMH/NIH/DHHS/USA/Earth
Program List • 3dttest++(GLM: one-, two-sample, paired t, between-subjects variables) • 3dMVM(generic AN(C)OVA) • 3dLME(sophisticated cases: missing data, within-subject covariates) • 3dMEMA(similar to 3dttest++: measurement errors) • 3dANOVA(one-way between-subject) • 3dANOVA2(one-way within-subject, 2-way between-subjects) • 3dANOVA3(2-way within-subject and mixed, 3-way between-subjects) • 3dttest(obsolete: one-sample, two-sample and paired t) • 3dRegAna(obsolete: regression/correlation, covariates) • GroupAna(obsolete: up to four-way ANOVA) • 3dICC(intraclass correlation): prototype only • 3dISC(intersubject correlation): prototype only
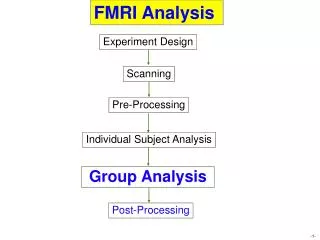
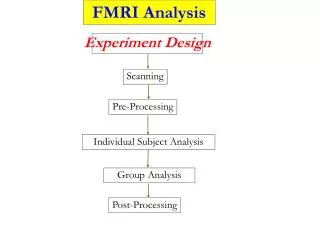
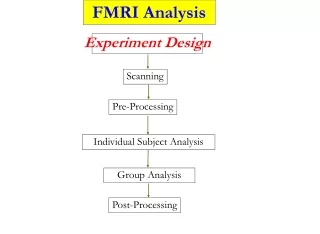
Preview of Coming Attractions • Concepts and terminology • Group analysis approaches • GLM: 3dttest++, 3dMEMA • GLM, ANOVA, ANCOVA: 3dMVM • LME: 3dLME • Presumed vs. estimated HDR (i.e., fixed vs. variable shape) • Miscellaneous • Issues with covariates • Intra-Class Correlation (ICC) • Inter-Subject Correlation (ISC) Goal = Give outline of AFNI capabilities in group analyses Decisions about complex situations require help https://afni.nimh.nih.gov/afni/community/board
Why Group Analysis? • Reproducibility and generalization • Summarization • Generalization: from current results to population level • Typically 10 or more subjects per group • Individualized inferences: pre-surgical planning, lie detection, … • One model combining both steps (single subject and group)? • + Ideal: less information loss, more accurate inferences • - Historical • - Computationally unmanageable, and very hard to set up • - Data quality check at individual level
Simplest case • BOLD responses from a group of 20 subjects • data: (β1, β2, …, β20)=(1.13, 0.87, …, 0.72) • mean: 0.92 • standard deviation of the betas: 0.40 or .90 • Do we have strong evidence for the effect being nonzero? • Statistical modeling perspective • Simplest GLM: one-sample t-test • Statistical evidence - t-test: • summarization: b(dimensional), sd, andt(dimensionless)
Terminology • Response/outcome variable: left-hand side of model • Regression βicoefficients (plus measurement errors) • Structured: subjects, tasks, groups • Explanatory variables: right-hand side of model • Categorical (factors) vs quantitative (covariates) • Fixed- vs random-effects: conventional statistics • Type of Models • Univariate GLM: Student’s t-tests, regression, AN(C)OVA • Multivariate GLM: within-subject factors • LME: linear mixed-effects model • MEMA: mixed-effects multilevel analysis • BML (Bayesian multilevel model)
Terminology: categorical vs quantitative • Factors • Finite (small) number of levels: categories (coded by labels) • Within-subject (repeated-measures): tasks, conditions • Between-subjects • patients/controls, genotypes, scanners/sites, handedness, … • Each subject nested within a group • Subjects: random-effects factor -measuring randomness • Of no intrinsic interest: random samples from a population • Quantitative variables • numeric or continuous • age, IQ, reaction time, brain volume, … • 3 usages of “covariate” • No interest: • Qualitative (e.g., scanner/site, groups) • Quantitative (e.g., per subject amount of head motion) • Explanatory variable (e.g., subject age, anxiety score)
Terminology: fixed vs random • Fixed-effects variables • Of research interest • Visual vs auditory, age, … • Unable to extend to something else • Modeled as constants, not random variables • Shared by all subjects • Not exchangeable/replaceable or extendable to something else • Random-effects variables (mean + random part) • Of research interest? • Subjects: random samples • Trials, regions? • Modeled as random variables: Gaussian distributions • Exchangeable, replaceable, generalizable • Differentiations blurred under BML (Bayesian Multi-Level)
Terminology: main effects • Main effect for a fixed-effects factor • Omnibus: overall inference or summarization • e.g., Evidence for differences across 3 levels • Conventional ANOVA framework • F-statistic: not detailed enough • Tells you something is different, but not which one • Further partitions: post hoc inferences via pairwise comparisons • F-statistic as a two-sided test? 1) A > B, 2) A < B 3) A
Terminology: interactions • Interaction effect between 2 or more factors • Omnibus: overall inference or summarization • Conventional ANOVA framework • F-statistic: not detailed enough to tell what specifically is happening • Further partitions: post hoc inferences via pairwise comparisons • 2 × 2 design: difference of difference • F-test for 2x2 interaction = t-test of (A1B1 - A1B2) - (A2B1 - A2B2) or (A1B1 - A2B1) - (A1B2 - A2B2)
Terminology • Interaction effect involving a quantitative variable • By default: linearity (age, modulation, …) • Controlling: misconception – e.g., “covary out” age differences? • or, Effect of interest • Interaction between a factor and a quantitative variable
Terminology • Interaction effect involving a quantitative variable • Validity of linearity of b with (e.g.) age • Nonlinear: difficult (too much freedom)! Polynomials? Theory-driven?
Explanatory variables Factor A (Group): 2 levels (patient and control) Factor B (Condition): 3 levels (pos, neg, neu – emotional words) Factor S (Subject): 15 ASD children and 15 healthy controls Quantitative covariate: Age Piecemeal: multiple t-tests – too tedious Group comparison + age effect Pairwise comparisons among three conditions Assumption: same age effect across conditions Difficulties with t-tests Main effect of Condition: 3 levels plus age? Interaction between Group and Condition Age effect across three conditions? Example: 2 × 3 Mixed ANCOVA
Factor A (Group): 2 levels (patient and control) Factor B (Condition): 3 levels (pos, neg, neu) Factor S (Subject): 15 ASD children and 15 healthy controls Covariate (Age): cannot be modeled; no correction for sphericity violation Classical ANOVA: 2 × 3 Mixed ANOVA (no covariate) Different denominators 3dANOVA3 –type 5 (equal # of subjects across groups)
Group: 2 levels (patient and control) Condition: 3 levels (pos, neg, neu) Subject: 3 ASD children and 3 healthy controls Univariate GLM: 2 x 3 mixed ANOVA • Difficult to incorporate covariates • Broken orthogonality of matrix • No correction for sphericity violation a d b X
Univariate GLM: problematic implementations (in some other software we won’t name) Two-way mixed ANOVA Between-subjects Factor A (Group): 2 levels (patient, control) Within-subject Factor B (Condition): 3 levels (pos, neg, neu) 1) Omnibus tests 2) Post hoc tests (contrasts) - Incorrectt-tests for factor A due to incorrect denominator -Incorrectt-tests for factor B or interaction effect AB when weights do not add up to 0 Correct Incorrect
Two-way repeated-measures ANOVA Within-subjects Factor A (Object): 2 levels (house, face) Within-subject Factor B (Condition): 3 levels (pos, neg, neu) 1) Omnibus tests 2) Post hoc tests (contrasts) - Incorrectt-tests for both factors A and B due to incorrect denominator - Incorrectt-tests for interaction effect AB if weights don’t add up to 0 Univariate GLM: problematic implementations Correct Incorrect
Group: 2 levels (patient and control) Condition: 3 levels (pos, neg, neu) Subject: 3 ASD children and 3 healthy controls Age: quantitative covariate Better Approach: Multivariate GLM Βn×m = Xn×qAq×m + Dn×m A D B B X Data = betas Model = Design matrix = Main Effect & Group Coding & Covariate Fit Parameters (to be computed) Residuals
MVM Implementation in AFNI Variable types Post hoc tests Program 3dMVM – generalize multi-way ANCOVA, and more No dummy coding needed! Symbolic coding for variables and post hoc testing Data layout
MVM General Linear Tests – besides main effects Symbolic coding for variables and post hoc testing -bsVARS ‘Grp*Age’shows 2 between subjects variables -qVars ‘Age’shows one is quantitative (numbers) So the other one Grp is categorical (labels) -wsVars‘Cond’shows 1 within subjects variable (categorical) Potential values for all variables collated from data table GLT #3“Grp : 1*Pat Cond : 1*Pos -1*Neg” Within the Grp variable, select the Pat mean effect Within the Cond variable, select the difference between the Pos and Neg mean effects Age is not specified, so test will be carried out on the effects regressed to the Age center (for each Grp) GLT #4“Grp : 1*Pat Age :”tests the slope of the betasw.r.t. Agefor Patients (averaged across Cond values)
Improvement 1: precision information • Conventional approach: βs as response variable • Assumptions • no measurement errors • all subjects have same precision • All subjects are treated equally (have the same randomness) • More precise method: estimated βs plus precision estimates • t-statistic contains precision (t = β / SEM(β) ) • βsand their t-stats as input • βs weighted based on precision • Only available for simple GLM types: 3dMEMA • Regions with substantial cross-subject variability • Best approach: combining all subjects in one big super-model • Currently not feasible
One group: Example • 3dttest++: β as input only 3dttest++ –prefix Vis -mask mask+tlrc-zskip \ -setA ‘FP+tlrc[Vrel#0_Coef]’ \ ’FR+tlrc[Vrel#0_Coef]’ \ …… ’GM+tlrc[Vrel#0_Coef]’ • 3dMEMA: βand t-statistic as input 3dMEMA –prefix VisMEMA -mask mask+tlrc -setA Vis \ FP ’FP+tlrc[Vrel#0_Coef]’ ’FP+tlrc[Vrel#0_Tstat]’ \ FR ’FR+tlrc[Vrel#0_Coef]’ ’FR+tlrc[Vrel#0_Tstat]’ \ …… GM ’GM+tlrc[Vrel#0_Coef]’ ’GM+tlrc[Vrel#0_Tstat]’ \ -missing_data 0 Voxel value = 0 treated it as missing Voxel value = 0 treated it as missing
Paired comparison: Example • 3dttest++: comparing two conditions 3dttest++ –prefix Vis_Aud \ -mask mask+tlrc–paired -zskip\ -setA ’FP+tlrc[Vrel#0_Coef]’ \ ’FR+tlrc[Vrel#0_Coef]’ \ …… ’GM+tlrc[Vrel#0_Coef]’ \ -setB ’FP+tlrc[Arel#0_Coef]’ \ ’FR+tlrc[Arel#0_Coef]’ \ …… ’GM+tlrc[Arel#0_Coef]’
Paired Comparison: Example • 3dMEMA: accounting for differential accuracy (among βs) • Contrast as input 3dMEMA –prefix Vis_Aud_MEMA \ -mask mask+tlrc-missing_data 0 \ -setA Vis-Aud \ FP ’FP+tlrc[Vrel-Arel#0_Coef]’ ’FP+tlrc[Vrel-Arel#0_Tstat]’ \ FR ’FR+tlrc[Vrel-Arel#0_Coef]’ ’FR+tlrc[Vrel-Arel#0_Tstat]‘ \ …… GM ’GM+tlrc[Vrel-Arel#0_Coef]’’GM+tlrc[Vrel-Arel#0_Tstat]’
Improvement 2: more accurate HDR • Conventional approach ) (q=4) • Presumed curve (empirical and approximate): BLOCK(d,1) • Fixing HDR shape and capturing magnitude with one number • Simple and straightforward: one β per effect • Not ideal: HDR varies across regions, tasks/conditions, groups, subjects • More accurate HDR modeling • Data driven (no assumptions about HDR shape): TENTzero, CSPLINzero • Estimating both shape and magnitude with multiple effect estimates • More complicated: multiple βs per task/condition • More challenging: how to make inferences? H0: β1=0, β2=0, …, βk=0 • Middle • Adjust major HDR curve with 2/3 auxiliary functions: SPMG2/3 • Focus: magnitude (β) associated with major HDR curve
Improvement 2: more accurate HDR • Group analysis with HDR estimates: TENTzero, CSPLINzero • NHST: H0: β1=0, β2=0, …, βk=0 [all responses in HRF = zero] • Area under curve (AUC) approach • Reduce HRF to one number: use area as magnitude approximation • Ignore shape subtleties • Shape information loss: (undershoot, peak location/width) • Better approach: maintaining shape integrity • Take individual βs to group analysis (MVM) • One group with one condition: 3dLME • Other scenarios: treat βs as levels of a factor (e.g., Time) - 3dMVM ** Task or group effect: F-stat for interaction between task group and Time, complemented with main effect for task/group (AUC) Chen et al. (2015). Detecting the subtle shape differences in hemodynamic responses at the group level. Front. Neurosci., 26 October 2015.
Improvement 2: more accurate HDR • 2 groups (children, adults), 2 conditions (congruent, incongruent), 1 quantitative covariate (age) • 2 methods: HRF modeled by 10 (tents) and 3 (SPMG3) bases • Effect of interaction: interaction group:condition – 3dMVM
Improvement 2: more accurate HDR • Advantages of ESM over FSM • More likely to detect HDR shape subtleties • Visual verification of HDR signature shape (vs. relying significance testing: p-values) Study: Adults/Children with Congruent/Incongruent stimuli (2×2)
Dealing with quantitative variables • Reasons to consider a covariate • Effect of interest: variability of response with some subject parameter • Model improvement: accounting for data variability with plausible cause • But you don’t particularly care about this effect per se • Frameworks • ANCOVA: between-subjects factor (e.g., group) + quantitative variable • Broader frameworks: regression, GLM, MVM, LME, BML • Assumptions: linearity, homogeneity of slopes (interaction) • Interpretations • Effect of interest: slope, rate, marginal effect • Regress/covariate out x? (e.g., head motion at individual level) • “Controlling x at …”, “holding x constant”: centering
Quantitative variables: centering • Model • α1, α2 - slope • α0 – intercept: group effect when x=0 • Not necessarily meaningful by itself • Linearity may not hold over large ranges of x1 or x2 • Centering covariates for interpretability • Mean or median centering? • When a factor is involved • Complicated decision: within-level or grand centering https://afni.nimh.nih.gov/pub/dist/doc/htmldoc/STATISTICS/center.html
A Useful Article about Covariates • Miller GM and Chapman JP. • Misunderstanding analysis of covariance • J Abnormal Psych 110: 40-48 (2001) • http://dx.doi.org/10.1037/0021-843X.110.1.40 • http://psycnet.apa.org/journals/abn/110/1/40.pdf
IntraClass Correlation (ICC) • Reliability (consistency, agreement/reproducibility) across two or more measurements of same/similar condition/task • sessions, scanners, sites, studies, twins • Classic example (Shrout and Fleiss, 1979): n targets are rated by k raters • Relationship with Pearson correlation • Pearson correlation: two different types of measure: e.g., BOLD response vs. RT • how much does one measurement type “explain” the other? • ICC: same measurement type – how reliable are the results? • Modeling frameworks: ANOVA, LME • 3 types of ICC: ICC(1,1), ICC(2,1), ICC(3,1) – one-, two-way random- and mixed-effects ANOVA • Whole-brain voxel-level ICC • ICC(2,1): 3dLME –ICC or 3dLME –ICCb • 3dICC: ICC(1,1), ICC(2,1) and ICC(3,1) Chen et al. (2017), Human Brain Mapping 39(3) DOI:10.1002/hbm.23909
Naturalistic scanning • Subjects view a natural scene during scanning • Visuoauditory movie clip (e.g., http://studyforrest.org/) • Music, speech, games, … • Duration: a few minutes (at least) or more • Close to naturalistic settings: minimally manipulated • Effect of interest: intersubject correlation (ISC) – 3dTcorrelate • Calculates correlation coefficient between voxel time series between subjects • Usual input is errts dataset after pre-processing to “correct” for motion, align to template space, et cetera • Extent of synchronization (“entrainment”) • Or of common response in that voxel/region across subjects to whatever they were experiencing • Whole-brain voxel-wise group analysis of these voxel-wise inter-subject correlations: 3dISC • Hasson et al., 2004. Intersubject synchronization of cortical activity during natural vision. Science 303:1634-1640.
ISC group analysis • Voxel-wise ISC matrix (usually Fisher/arctanh-transformed) • One group • Two groups • Within-group ISC: R11, R22 • Inter-group ISC: R21 • 3 group comparisons: R11 vs R22, • R11 vs R21, R22 vs R21
Complexity of ISC analysis • 2 ISC values associated with a common subject are correlated with each other: 5 subjects ⇢ 5x4/2 = 10 ISC values • i.e., random fluctuations in inter-subject correlations are correlated • ρ ≠ 0 (unknown) characterizes non-independent relationship • Challenge: how to handle this irregular correlation matrix?
ISC: LME approach • Modeling via effect partitioning: crossed random-effects LME • Charactering the relatedness among ISCs via LME within-subject cross-subject Chen et al, 2016. Untangling the Relatedness among Correlations, Part II: Inter-Subject Correlation Group Analysis through Linear Mixed-Effects Modeling. Neuroimage. NeuroImage 147:825-840
Summary • Concepts and terminology • Group analysis approaches • GLM: 3dttest++, 3dMEMA • GLM, ANOVA, ANCOVA: 3dMVM • LME: 3dLME • Presumed vs. estimated HDR • Miscellaneous • Issues with covariates • Intra-Class Correlation (ICC) • Inter-Subject Correlation (ISC)
Program List • 3dttest++(GLM: one-, two-sample, paired t, between-subjects variables) • 3dMVM(generic AN(C)OVA) • 3dLME(sophisticated cases: missing data, within-subject covariates) • 3dMEMA(similar to 3dttest++: measurement errors) • 3dANOVA (one-way between-subject) • 3dANOVA2 (one-way within-subject, 2-way between-subjects) • 3dANOVA3 (2-way within-subject and mixed, 3-way between-subjects) • 3dttest(obsolete: one-sample, two-sample and paired t) • 3dRegAna(obsolete: regression/correlation, covariates) • GroupAna(obsolete: up to four-way ANOVA) • 3dICC(intraclass correlation): prototype only • 3dISC(intersubject correlation): prototype only