Download
1 / 10
100 likes | 236 Vues
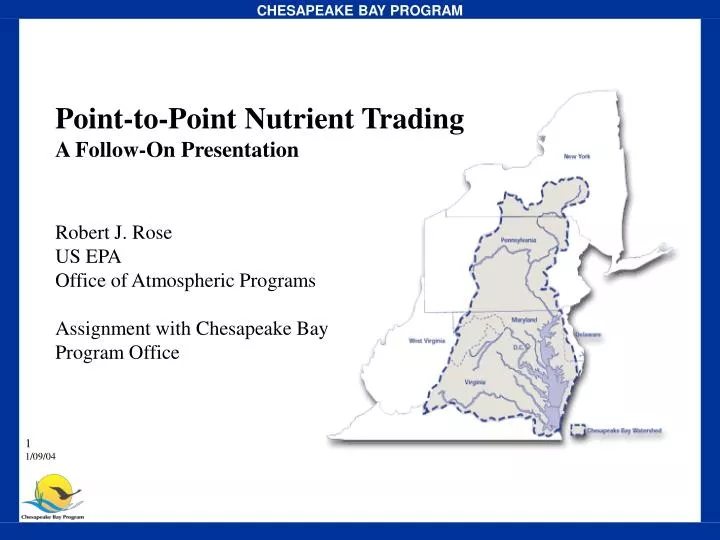
Point-to-Point Nutrient Trading A Follow-On Presentation. Robert J. Rose US EPA Office of Atmospheric Programs Assignment with Chesapeake Bay Program Office. Original Presentation ( www.chesapeakebay.net; Calendar of Events; December 3, 2003; Nutrient Subcommittee)

E N D
Point-to-Point Nutrient Trading A Follow-On Presentation Robert J. Rose US EPA Office of Atmospheric Programs Assignment with Chesapeake Bay Program Office
Original Presentation • (www.chesapeakebay.net; Calendar of Events; December 3, 2003; Nutrient Subcommittee) • Trading is a regulatory tool • Trading need not harm local water quality • Today’s Presentation • Regulatory flexibility • Population growth & capacity • Costs • Technology standards
Regulatory Flexibility • Ozone Transport Commission hosts interstate NOx trading including NY, PA, MD, DE, DC • A simple tracking database ties the process together • A similar database could potentially allow nutrient trading using any regulatory mechanism • Jurisdictions could participate if interested • If a jurisdiction participates, wastewater facilities would not have to participate • Facilities could form trading associations, roll-up allocations, and establish internal rules
What It Might Take • PA is motivated to develop infrastructure as part of a larger PA endeavor • CBPO committee(s) could develop common database criteria required • CBPO committee(s) could develop deliver ratios used for “Bay credits” and “tributary credits” that protect local and regional waters • Region III Bay permit workgroup will investigate legal aspects
Example: 5-year permit renewal (or any overlay regulation/permit) • Facilities receive a Bay allocation and a tributary allocation where applicable, with reference to tracking database • Facilities may sign-up for an account and password • Nutrient loads are entered once each calendar year • Database calculates surplus/deficit Bay credits and tributary credits • Annually, accounts are electronically settled (i.e., trading) • Early upgrades earn credits
Population Growth & Capacity • If building pipes were free, interconnecting facilities Bay-wide would allow 32 years of growth without expansion* • Delivery ratios are virtual pipes that interconnect nutrient treatment capacity Population Growth • Bay-wide Wastewater Treatment • Excess capacity 37% • (Source: CBPO) * Assuming 1% annual growth rate spread across Bay-wide 37% excess capacity
Allocation Choices Example: 23 Mlbs TN annually; 62% decrease from 2000; 38 years of growth; $2.8B Bay-wide Years of growth, 3mg/L technology, ideal trading conditions UAA Cost Less 20%* * Engineering study of 66 MD facilities concludes costs would be 32 % lower than UAA; Hampton Roads Sanitation District study concludes 23% lower than UAA
Costs • Trading spreads costs at least as equitably other policies • Local facility managers decide if upgrades and/or credits are ultimately cheapest for local ratepayers • Examples: • Some facilities could partially reduce nutrients by modifying operations for little cost, purchasing credits to make up the difference • Facilities with excess capacity could, and would have incentive, to operative below 3 mg/L, thus best leveraging capital investments • A facility initially not interested in trading might overshoot its allocation a given year, and could purchase credits as an alternative to penalties
Costs • Trading is estimated to reduce costs 20%1 • 3 mg/L @ today’s design flow • 62% TN reduction from municipal wastewater • 38 years of growth • $2.24B Bay-wide • $2.33/household/month2 1 Study of 66 MD facilities; estimates and experience in Connecticut's Long Island Sound Trading (~79 facilities) 2 Spread over 4 million households, 20 years
Technology Standards • No incentive to leverage excess capacity • No credit for low-cost and no-cost partial reductions • Less able to handle population growth • Less enforcement flexibility • Grants tied to technology standards suffer the same limitations • Highest cost option