Download
1 / 25
260 likes | 395 Vues
The Arctic Ocean (Carbon Cycle) in a Changing Environment Leif G. Anderson Department of Chemistry, Göteborg University Göteborg, Sweden. The Arctic Ocean. Extremely large shelf areas (~50% of AO) Deep central basin More runoff input than any other ocean

E N D
The Arctic Ocean (Carbon Cycle) in a Changing Environment Leif G. Anderson Department of Chemistry, Göteborg University Göteborg, Sweden
The Arctic Ocean • Extremely large shelf • areas (~50% of AO) • Deep central basin • More runoff input than • any other ocean • Partially sea-ice covered • all year around, i.e. the • shelves seasonally ice • free
Arctic Ocean circulation Much input from Pacific & Atlantic over shelves. Shelf water ventilate the deep basin. Intermediate & deep waters follows the topography counter-clockwise. The deep waters contribute to the Global Thermohaline Circulation.
Arctic Change Warming of the Atlantic layer water 2004 1999 Polyakov, I. V., et al. (2005), One more step toward a warmer Arctic, Geophys. Res. Lett., 32, L17605, doi:10.1029/2005GL023740 1998
The deep water formed in the Arctic Ocean and Greenland Sea are feeding the Global Thermohaline Circulation (THC).
Deep water formation might be hampered by to much freshwater. What sources are where? Tracing freshwater sources by applying relationships of phosphate - nitrate, and total alkalinity - salinity. Pacific Water, S~32 River Runoff Atlantic Water Sea Ice Melt
Pacific freshwater is confined to the Canada Basin. River runoff to the Canadian and Amundsen Basins. Sea ice melt is abundant in the Canada Basin and north of Svalbard. Total Freshwater Pacific Freshwater River Runoff Sea Ice Melt
Arctic Change Increasing winter-river discharge to the Arctic Ocean Peterson et al., 2002 Catchments and average annual discharge
Modelled relationship between THC strength and changes to Arctic riverine freshwater discharge from all rivers simultaneously (solid triangles) or individual rivers (solid circles). The inset figure is a subset of the larger figure and shows the linear trend between THC strength and changes to riverine freshwater input between ±700 km3 yr-1. The letters on the inset figures top axis refer to which river’s runoff that was perturbed: Y-Yenisei, L-Lena, Ob-Ob, M-Mackenzie, P-Pechora, D-Dvina, Ko-Kolyma, I-Indigirka, O-Olenek, Y-Yana, K-Khatanga. The THC strength is computed as the maximum meridional overturning streamfunction in the North Atlantic. Rennermalm, et al. (2006), Sensitivity of the thermohaline circulation to Arctic Ocean runoff, Geophys. Res. Lett., 33, L12703, doi:10.1029/2006GL026124.
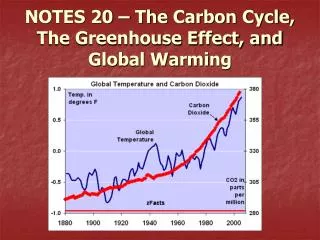
% from http://nsidc.org/data/seaice_index/ Arctic Change Shrinking summer sea ice cover. Ice concentration anomaly in August 2004 compared to the monthly mean over the period 1979-2000, based on estimates using satellite passive microwave data
Shelf processes Includes biological production and decay, water mass modification, air-sea exchange, sedimentation and resuspension, terrigenous input, etc.
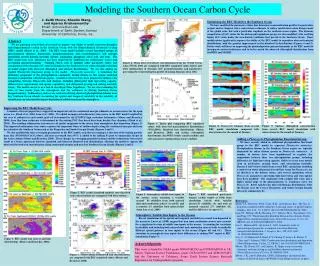
Present value The pCO2 of the surface waters in the Arctic Ocean calculated with data collected during the cruises from left: AOS 94, ACSYS 96, & Beringia 2005.
The potential uptake capacity of carbon in the winter mixed layer of the Arctic Ocean based on the pCO2 under-saturation. The potential uptake varies with time and location, but the average is close to 10 gC m-3, which corresponds to about 50x1012 gC over the deep central basins. AOS 94 ACSYS 96 Beringia 2005
pCO2 in the Chukchi Sea region and the impact of Ice Cover on Air-Sea flux Bates et al. GRL 2006 Large areas of under-saturated surface water, but no trend with ice cover. But as the flux much depends on the transfer energy at the sea surface it varies from zero in ice covered regions to ~60 mmol CO2 m-2d-1 (~0.7 gC m-2d-1) in ice free waters. Hence a decrease in ice cover has a major impact on the flux!
Decreased ice cover will potentially increase upwelling, and thus also increase nutrient supply to the photic zone. Model Results: A circulation ‘cell’ forms with upwelling at the coast and downwelling at the ice edge. Only shelf water circulates if the shelf-break is ice-covered. Continued retreat of summer ice cover exposes more and more of the shelf-break for longer periods of time to upwelling favorable winds. Upwelling depth increases as slope waters become ice-free. Salty, nutrient-rich water can now cross the whole shelf in a thin bottom boundary layer. From: Carmack & Chapman, GRL, 2003
Decreased ice cover increased upwelling increased nutrient supply Pacific side; nutrients higher at ~100 m, but profile more stratified compared to Atlantic side. S S PO4 PO4 Beringia 2005 & Polarstern 1996
Decreased ice cover increased upwelling increased nutrient supply, but also increased pCO2 supply, which compensate the oceanic C-uptake! Also, if nutrients are mixed up at the Pacific side it will be followed by DIC, which compensate the effect of a potential increase in PP. DIC fCO2 Beringia 2005
Sea Ice production, brine formation and gas exchange Storfjorden April 2002 I/B Oden DIC (µmol/kg) p CO2 (µatm)
--21°E --78°N Kapp Lee --78°N Storfjorden --21°E Kvalvagen From Kvalvagen to Kapp Lee : ca. 100 km S t o r f j o r d e n, A p r i l 2 0 0 2. Courtesy of Jean-Claude Gascard
Methane hydrates, the potential greenhouse gas bomb! The total amount of methane in the Arctic Ocean sediments is estimated to 540 Gton C*, which to a large degree could be released when warmer waters penetrates the shelves. Other processes like coastal erosion also promote a release! Much methane hydrates are also buried in the tundra, but the difference is that on land the temperature gets very cold in winter, while the bottom water temperature on the shelf are close to the freezing point all year around! Summer temperatures are ~1 oC while winter are near -1 oC. This makes the thermal abrasion rate 0.05 – 0.2 m yr-1. NSIDC data (Brown et al. 1998) on Google Earth * Kvenvolden, K.A., 1988. Methane hydrates and global climate. Global Biogeochemical Cycles 2 (3), 221–229.
Methane hydrates ………… The Arctic shelf is currently undergoing dramatic thermal changes caused by the continued warming associated with Holocene sea level rise. During this transgression, comparatively warm waters have flooded over cold permafrost areas of the Arctic Shelf. A thermal pulse of more than 10 oC is still propagating down into the submerged sediment and may be decomposing gas hydrate as well as permafrost. Paull, et al. (2007), Origin of pingo-like features on the Beaufort Sea shelf and their possible relationship to decomposing methane gas hydrates, Geophys. Res. Lett., 34, L01603, doi:10.1029/2006GL027977.
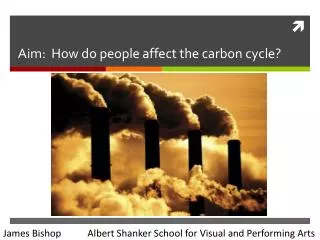
High methane concentrations are found in the Arctic shelf seas in the summer, with more than 80% samples collected in the East Siberian Sea oversaturated (maximum 4 400%)*. These concentration result in average flux estimates of ~1x10⁴ g CH4 km-2, with maximum being at least one order higher. For the whole region of the map this correspond to a loss of 0.5x10¹² and 0.15x10¹² g C in 2003 and 2004, respectively. Compare with total coastal seas flux, 1 x10¹²g C yr-1. There are three dominating sources of methane in the Arctic marine environment: From organic matter that is decomposed microbially, from the river runoff, and from the Pleistocene carbon (frozen and thawed). The last one may not yet be so important, but it will likely decrease. 2003 2004 * Shakhova, N. and I. Semiletov, Journal of Marine Systems, 2007 Estimated methane flux from surface layer.
Atmosphere and land What about the future? Feedbacks to changes: sea ice production There is a need to understand the processes and how they interact within the climate system. air-sea CO2 exchange ocean circulation methane primary production deep water formation And all its effects on the human dimension; fisheries, transportation, natural resources, coastal erosion, pollution, culture, etc.