Download
1 / 58
580 likes | 785 Vues
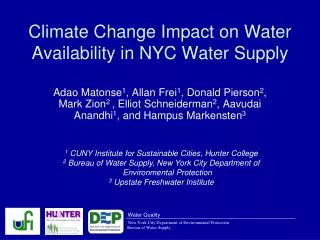
VULNERABILITIES OF WATER AVAILABILITY AND AGRICULTURE TO CLIMATE CHANGE, YAKIMA RIVER BASIN, WASHINGTON. U.S. Department of the Interior U.S. Geological Survey. Start With Overview of Tools Used to Assess Global Warming. PRMS - USGS Watershed Model

E N D
VULNERABILITIES OFWATERAVAILABILITY AND AGRICULTURE TO CLIMATE CHANGE, YAKIMA RIVER BASIN, WASHINGTON U.S. Department of the Interior U.S. Geological Survey
Start With Overview of Tools Used to Assess Global Warming PRMS - USGS Watershed Model DPM - USGS Water-Budget Model (Both Use a Daily Time-Step)
PRMS DPM
Areas modeled for estimating current condition recharge for input to a regional groundwater model DPM MODELS PRMS MODELS
WHAT HAPPENS IF YOU WARM UP THE BASIN? Methods : 1) GCM time-varying output modifying current climate 2) Look at temperature increase at some point in “time” and modify current climate Either can use an effective change for all months or a change that varies by month
Yakima Flathead Starkweather Cathance Sprague Pomperaug Blackearth Sagehen Yampa Feather Spring Clear East Flint Integrated watershed scale response to global change in selected basins across the United States Lauren Hay and Steven Markstrom (NRP/CR) David Bjerklie (WSC/CT), Katherine Chase (WSC/MT), Robert Dudley (WSC/ME), John Fulton (WSC/PA), Randy Hunt (WSC/WI), Anne Jeton (WSC/NV), Kathryn Koczot (WSC/CA, Mark Mastin (WSC/WA), Richard Niswonger (WSC/NV), John Risley (WSC/OR), Kevin Vining (WSC/ND), and John Walker (WSC/WI)
EXAMPLE: GCM time-varying output modifying current climate From Hay and Mastin, USGS, 2008
EXAMPLE: Look at temperature increase at some point in time and modify current climate CASE: 2°C 1981-2005 59% DECREASE = 1.1 MILLION ACRE-FEET MASTIN, USGS, 2008
CHANGE FROM BASE: Mean Annual Discharge CASE: 2°C BASE: 1981-2005
78% Storage upper basin 5000 cfs Mastin, USGS, 2008 SENSITIVITY OF RESERVOIR INFLOW AND RESULTING STREAMFLOW TO 1°C AND 2°C WARMING
…to be added to historical trends already being observed in the region. Stewart et al., 2005, Climate Change, V. 62 Dettinger and Cayan, 1995; Cayan et al., 2001
THIS EARLIER RUNOFF CAN BE SEEN BY COMPARING AVERAGE HYDROGRAPHS FOR THE 1947-1976 PERIOD TO THE POST-1976 PERIODTHE 1976-1977 CHANGE REPRESENTS A REGIONAL SHIFT IN HYDROCLIMATE REGIMES: POST-1976 HYDROGRAPHS DISPLAY A SUBDUED VERSION OF THE PROJECTED GLOBAL CHANGES
Yakima River at Martin (Inflow to Keechelus Lake) AVE 1977-2008 AVE 1947-1976 REMEMBER THE 1°C WARMING
APRIL 1-WATER RIGHT FOR 1ST IRRIGATION TEANAWAY RIVER NOTE: MAY APRIL JUNE MARCH FEBRUARY JULY Mean Annual = 350 ft3/s, D.A. 170 square miles
IRRIGATION SEASON EXTENDS THROUGH OCTOBER OCTOBER SW RIGHTS ??? FISH ??? AUGUST SEPTEMBER TEANAWAY RIVER: Drought year: 08/28/2005 7.32 ft3/s
Monthly Minimum Air Temperature, Cle Elum MAY APRIL MARCH JANUARY
GLACIER THICKNESS CHANGE, 1970-2004 (Bidlake, 2007) 10 MILLION CUBIC METERS OF WATER LOST FROM THE GOAT ROCKS GLACIERS
SNOWMELT IS A MAJOR COMPONENT OF SPATIALLY DISTRIBUTED GROUNDWATER RECHARGE -- 30-70% OF MELTProvides Cold Water for Later Discharge to Streams and Prevents Winter Icing
Tieton R Bull Trout Distribution, from U.S.F.W.S.
SOME FACTORS AFFECTING WATER MANAGEMENT IN THE BASIN • SENIOR RIGHTS, including Tribal Rights • JANUARY 31, 1945 CONSENT DECREE • 1980 FEDERAL CIRCUIT COURT DECISION TO PROTECT INCUBATING SPRING CHINOOK EGGS AND ALEVINS IN THE UPPER YAKIMA RIVER BASIN • TITLE XII INSTREAM FLOWS (10/31/94) (SUNNYSIDE AND PROSSER DAMS)
RECLAMATION OPERATES THE RESERVOIRS TO MEET MOST OF THE ENTITLEMENTSWhat are the Entitlements and What about Operations – Back to EARLIER RUNOFF AND Then onto PRORATING
PRORATING • Occurs for Post-1905 SW Rights • Prorating has ranged from 37% TO 88% (adjusted throughout year) • Above PARKER: 1.3 Million AF of 2.5 MAF of Entitlements is Proratable • 1% TO 100% of a District’s Entitlement
Depths ofAllWells In Feet
GROUNDWATER RIGHTS Note: about 25% of Irrigation Rights are Standby/Reserve Rights
What Is Currently Happening To Groundwater Storage Due to Pumpage in Areas Outside of Irrigation Districts?
MANY BELIEVE GROUND WATER WILL SUPPLEMENT SURFACE-WATER SUPPLIES IN A WARMING WORLD BECAUSE GROUNDWATER IS ‘BUFFERED’ AGAINST A WARMING CLIMATE
SIMPLE EXAMPLES OF WARMING AFFECTS ON CROPS IN THE YAKIMA RIVER BASIN • CALCULATIONS FOR SUNNYSIDE, WA • ASSUME A 3 DEGREE FAHRENHEIT WARMING • LOOK AT CHANGES IN CROP-WATER USE • ASSUMES APRIL 1 START IRRIGATION • DAILY VALUES WATER-YEARS 1949-2003 • IRRIGATION RATE SAME FOR ALL YEARS
GENERAL ASPECTS • MEAN ANNUAL POTENTIAL EVAPOTRANSPIRTATION INCREASED BY ABOUT 4.3 INCHES • FOR IRRIGATED LANDS, INCREASE IN EVAPORATIVE DEMAND IS ABOUT EQUIVALENT TO 180,000 ACRE-FT (BETWEEN KEECHELUS AND RIMROCK STORAGE CAPACITIES)
Monthly Minimum Air Temperature, Sunnyside APRIL MARCH FEBRUARY JANUARY
Results vary by soil type (119 categories for lower basin) • Results very dependent on irrigation method • Much to gain by improvement in irrigation methods and (?) conveyance systems • If all croplands > 2.5 ft of demand switched to < 2.5 ft, a reduction in total demand of ~500,000 acre-feet per year may be possible
IMPORTANCE OF SW & GW RETURN FLOWS EXAMPLE: AUGUST 15, 2001 VALUES IN CUBIC FEET PER SECOND YAKIMA RIVER AT PARKER 357 CHANDLER POWER CANAL 479 YAKIMA RIVER AT PROSSER 308 GAIN OF 430 YAKIMA RIVER AT KIONA 1,033 GAIN OF 449 KENNEWICK CANAL 203
MEAN ANNUAL REDUCTION IN RECHARGE OF ABOUT 20 PERCENT WITH A 3 DEGREE FARHENHEIT WARMING
93 ft3/s reduction in mean recharge, about equal to total pumpageforirrigation from the basin-fill deposits in 2001 ASSUMES IRRIGATION STARTS APRIL 1 FIVE-YEAR MOVING AVERAGES OF GROUNDWATER RECHARGE Vaccaro, 1992, JGR
ABOUT A 25% REDUCTION IN MEAN ANNUAL RECHARGE SENSITIVITY OF 2°C INCREASE ON RECHARGE, YAKIMA RIVER BASIN
from U.S. F.W.S. LARGE % OF YAKIMA RIVER STEELHEAD PRODUCTION AREA OF LARGE GROUNDWATER LEVEL DECLINES