Download
1 / 41
410 likes | 540 Vues
Sibiu - Cosmo General Meeting 2-5 September 2013. SEASONAL COMMON PLOT SCORES 2012-2013 Adriano Raspanti Performance diagram by M.S Tesini. THE MODELS. COSMO-RO (NMA). COSMO-7 (MCH). COSMO-EU (DWD). COSMO-PL(IMGW). COSMO-I7 (IT). COSMO-ME (IT). COSMO-GR (HNMS).

E N D
Sibiu - Cosmo General Meeting 2-5 September 2013 SEASONAL COMMON PLOT SCORES 2012-2013Adriano RaspantiPerformance diagram by M.S Tesini
THE MODELS COSMO-RO (NMA) COSMO-7 (MCH) COSMO-EU (DWD) COSMO-PL(IMGW) COSMO-I7 (IT) COSMO-ME (IT) COSMO-GR (HNMS)
Standard Verification • Period: JJA 2012, SON 2012, DJF2012/2013, MAM 2013 • Run: 00 UTC run • Continuous parameters - T2m, Td2m, Mslp, Wspeed, TCC • Scores : ME, RMSE • Forecasts Step: every 3 hours • Dichotomic parameters - Precipitation: • Scores: FBI-POD-FAR-TS with Performance Diagram • Cumulating: 6h and 24h • Thresholds: 0.2, 0.4, 0.6, 0.8, 1, 2, 3, 4, 5, 6, 7, 8, 9, 10, 12, 14, 16, 18, 20 mm/6h and mm/24h
Conditional Verification • 2mT verification with the following criteria (1 condition): • Total cloud cover >= 75% (overcast condition) (condition based on observations) • Total cloud cover <= 25% (clear sky condition) (condition based on observations) • 2mT verification with the following criteria (2 conditions): • Total cloud cover >= 75% (overcast condition) ANDWind Speed<2.5 m/s (condition based on observations) • Total cloud cover <= 25% (clear sky condition) ANDWind Speed<2.5 m/s (condition based on observations)
Standard Verification on Common AreaNEW! • Period: DJF2012/2013, MAM 2013 • Run: 00 UTC run • Continuous parameters - T2m, Td2m, Mslp, Wspeed, TCC • Scores : ME, RMSE • Forecasts Step: every 3 hours • Dichotomic parameters - Precipitation: • Scores: FBI-POD-FAR-TS with Performance Diagram • Cumulating: 6h and 24h • Thresholds: 0.2, 0.4, 0.6, 0.8, 1, 2, 3, 4, 5, 6, 7, 8, 9, 10, 12, 14, 16, 18, 20 mm/6h and mm/24h
TEMPERATURE AT 2 M - JJA 2012 – MAM 2013 Significant diurnal cycle with almost the same phase for all models: more pronounced negative bias during daytime especially DJF and MAM. Tendency to underestimation DJF and MAM for almost all the model (no C-RU)
DEW POINT TEMPERATURE - JJA 2012- MAM 2013 The behaviour of the models is quite different depending on the season. Peculiar ME for CRU in DJF for overestimation (higher RMSE) while the others underestimate and C-I7 (DJF and MAM) almost shifted the diurnal variation. RMSE quite variable. Many models show underestimation (CGR always)
MEAN SEA LEVEL PRESSURE - JJA 2012 – MAM 2013 The behaviour of the models different depending on the season. Worth noting strong underestimation in MAM for some models especially CEU and strong overestimation of CGR, CME, CI7 in DJF
WIND SPEED AT 10 M - JJA 2011 – MAM 2012 C-GR shows always bias around 0 (less in DJF), while the others separate in 2 groups IFS driven (under) and GME driven (over), but maybe also with less complex orography. In RMSE peculiar behaviour for C-EU that has lower values.
TOTAL CLOUD COVER JJA 2012 – MAM 2013 Clear diurnal cycle for all the models with a general tendency to overestimation except for C-EU that has the opposite behaviour especially in SON and JJA. C-GR shows very low RMSE in JJA
2MT in Sky Clearconditions - JJA 2012 – MAM 2013 Clear diurnal cycle for all the models with a general tendency to underestimation in DJF and MAM (maybe poor sample) and amplitude of the error pronounced. RMSE between 2° and 4-5°.
2MT in Overcastconditions - JJA 2012 – MAM 2013 Diurnal cycle for all the models almost disappeared. Me is around 0 in SON (except CGR) while for DJF and MAM tendency to underestimation except CME and CEU in MAM. RMSE generally lower than the previous condition.
2MT in Overcastconditions and No advection - JJA 2012 – MAM 2013 Less evident diurnal cycle for all the models . Me is in general around with tendency to underestimation in DJF and MAM. RMSE generally lower in DJF and MAM than the other seasons
2MT in Clear Sky conditions and No advection - JJA 2012 – MAM 2013 Clear diurnal cycle for all the models with a general tendency to underestimation in DJF and MAM (maybe poor sample) during daytime and amplitude of the error pronounced. RMSE between 2° and 5° and with diurnal cycle too.
TEMPERATURE AT 2 M - DJF 2013 – MAM 2013 CA VD DJF and MAM: ME, CPL CGR and increase underestimation in the CA while CEU, CME and CI7 decrease this tendency. RMSE in CA worse for CPL and CGR, while CI7, CEU and CME slightly improve.
MEAN SEA LEVEL PRESSURE - DJF 2013 – MAM 2013 CA VD DJF: CEU shows in both domains no bias value. CI7, CME and CGR show in VD overestimation that disappears in the CA (maybe due to the extreme variability of weather in the countries. It is worth to note the evident peculiar underestimation of CRO in VD. RMSE shows an improvement for CI7 and CEU, a steady value for CME and CGR, a clear worsening for CPL in the CA MAM: as ME CEU shows in both domains underestimation. CPL shows almost no bias value for its own domain, but is overestimated in CA. Other models can be considered steady. RMSE shows an improvement for CRU and CEU, CGR shows higher values. CPL RMSE in CA is out of scale.
WIND SPEED AT 10 M - DJF 2013 – MAM 2013 CA VD DJF and MAM: CME and CI7 underestimate in VD but overestimate in the CA. CPL and CGR show similar ME, while CEU is slightly worse. CME, CI7 and CGR improve dramatically RMSE.
TOTAL CLOUD COVER DJF 2013 – MAM 2013 CA VD DJF : Models looks similar, but with some peculiarities. The spread among the models of ME and RMSE is smaller for CA, but CEU, CPL worsen their performance, while CME and CI7 improve for both ME and RMSE. MAM: Models looks similar, but with some peculiarities. The spread among the models of ME and RMSE is smaller for CA. CPL performances are worse in CA. All the models are generally overestimated and behave better in the CA in terms of RMSE.
Some points to remember about precipitation verification: • The purpose of these plots is to see the overall performance of COSMO model • Relative comparison is not fair because models are different (ic/bc, assimilation cycle, model version, region characteristics, number of stations used) • Only some thresholds and cumulation time have been considered • they identify different rainfall regime depending on seasons and geographical characteristics
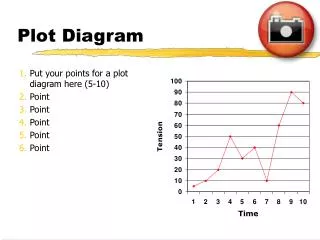
Performance diagram • In the graph is exploited the geometric relationship between four measures of dichotomous forecast performance: • probability of detection (POD) • success ratio(SR, defined as 1-FAR) • bias score (BS) • threat score (TS, also known as the Critical Suc-cess Index). • For good forecasts, POD, SR, bias and TS approach unity, such that a perfect forecast lies in the upper right of the diagram. • The cross-hairs about the verification point represent the influence of the sampling variability. • They are estimated using a form of resampling with replacement bootstrapping from the verification data (from the contingency table). • The bars represents the 95th percentile range for SR and POD.
Cumulation period: 24 h • All the models start at 00 UTC so we considered: • + 0h to +24h (day 1) • +24h to +48h (day2) • +48h to +72h (day3) • Reference threshold: • 0.2 mm • 2 mm • 10 mm • 20 mm
Good FBI in SON, except CPL always overestimated. Low performances in JJA. Overestimation in DJF and except CGR. Note D2 and D3 for CGR in MAM (generally overestimated all the models)
Generally worse increasing the threshold. Good FBI in SON. High variability for CGR (the sample?)
Inter-comparison over the same domain • In the previous diagrams the shown scores were evaluated on each own country • Now on the common domain (only DJF and MAM)
VD CA In CA the differences between models are less evident than in their own domains, maybe due to the diversity of the rain regimes. High FBI, except CPL in MAM
VD CA Again less differences in CA. CEU, C7 and CRU grouped together. High FBI
VD CA Again less differences in CA. CEU, C7 and CRU grouped together
VD CA Low values increasing the thres. Especially CEU and C7 (also CRU) in both domain.
Cumulation period: 6 h • We considered for the 6h cumulation period only the first day of forecast: • + 0h to +6h • + 6h to +12h • + 12h to +18h • + 18h to +24h • Reference threshold: • 0.2 mm • 5 mm • 10 mm
CPL keeps low performances (all in JJA). Note the high variability of the scores also differences with fcs steps.
Inter-comparison over the same domain • In the previous diagrams the shown scores were evaluated on each own country • Now on the common domain (only DJF and MAM)
VD CA Again models are grouped together in CA, except CPL in MAM, with tendency to overestimation
VD CA • Again models are grouped together in CA, except CPL in MAM, with tendency non bias position. Not dramatic differences with fcs steps.
VD CA Again models are grouped together in CA with lower performances and tendency to underestimate especially in DJF
To be discussed together! conclusion