Download
1 / 33
350 likes | 550 Vues
Unsupervised Learning. Clustering K-Means. Recall: Key Components of Intelligent Agents. Representation Language: Graph, Bayes Nets, Linear functions Inference Mechanism: A*, variable elimination, Gibbs sampling

E N D
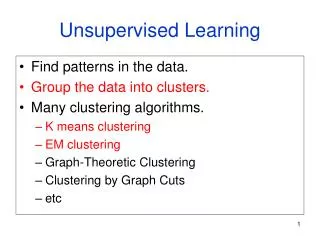
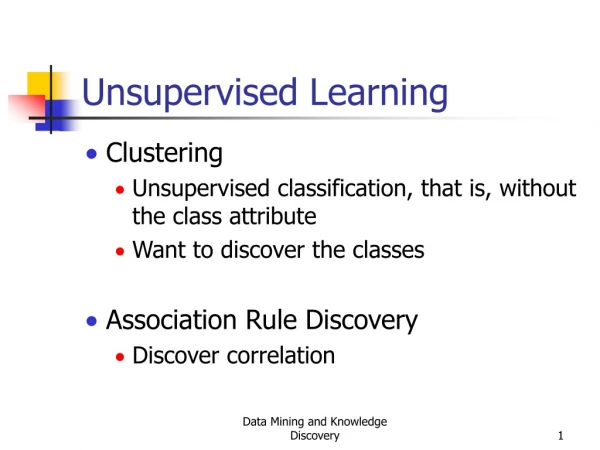
Unsupervised Learning Clustering K-Means
Recall: Key Components of Intelligent Agents Representation Language: Graph, Bayes Nets, Linear functions Inference Mechanism: A*, variable elimination, Gibbs sampling Learning Mechanism: Maximum Likelihood, Laplace Smoothing, gradient descent, perceptron, k-Nearest Neighbor, many more: k-means, EM, PCA, … ------------------------------------- Evaluation Metric: Likelihood, quadratic loss (a.k.a. squared error), regularized loss, margins, many more: 0-1 loss, conditional likelihood, precision/recall, …
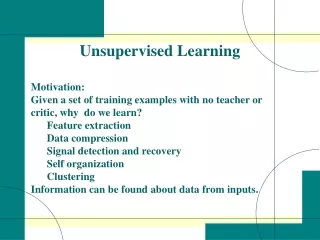
Supervised vs. Unsupervised Learning In supervised learning, the learning algorithm is given training examples that contain inputs (the X values) and “labels” or “outputs” (the Y values). In unsupervised learning, the learning algorithm is given training examples that contain inputs (the X values), but no “labels” or “outputs” (no Y values). It’s called “unsupervised” because there are no “labels” to help “supervise” the learning algorithm during the learning process, to get it to the right model.
Example Unsupervised Problem 1 Are these data points distributed completely randomly, or do you see some structure in them? How many clusters do you see? None 1 2 3 4 5 X2 X1
Example Unsupervised Problem 1 Are these data points distributed completely randomly, or do you see some structure in them? Structured – there are clusters! How many clusters do you see? None 1 2 3 4 5 X2 X1
Example Unsupervised Problem 2 There are 2 input variables, X1 and X2, in this space. So this is called a “2-dimensional space”. How many dimensions are actually needed to describe this data? 0 1 2 3 X2 X1
Example Unsupervised Problem 2 There are 2 input variables, X1 and X2, in this space. So this is called a “2-dimensional space”. How many dimensions are actually needed to describe this data? 1dimension captures most of the variation in this data. 2 dimensions will capture everything. X2 X1
Types of Unsupervised Learning Density Estimation - Clustering (Example 1) - Dimensionality Reduction (Example 2) Factor Analysis - Blind signal separation
Example Open Problem in AI: Unsupervised Image Segmentation (and Registration) Examples taken from (Felzenszwab and Huttenlocher, Int. Journal of Computer Vision, 59:2, 2004). http://cs.brown.edu/~pff/segment/.
The K-Means Clustering Algorithm Inputs: • Some unlabeled (no outputs) training data • A number K, which must be greater than 1 Output: A label between 1 and K for each data point, indicating which cluster the data point belongs to.
Visualization of K-Means 1. Generate K random initial cluster centers, or “means”.
Visualization of K-Means 2. Assign each point to the closest “mean” point.
Visualization of K-Means 2. Assign each point to the closest “mean” point. Visually, the mean points divide the space into a Voronoi diagram.
Visualization of K-Means 3. Recompute the “mean” (center) of each colored set of data. Notice: “means” do not have to be at the same position as a data point, although some times they might be.
Visualization of K-Means 3. Recompute the “mean” (center) of each colored set of data. Notice: “means” do not have to be at the same position as a data point, although some times they might be.
Visualization of K-Means 4. Repeat steps 2 & 3 until the “means” stop moving (convergence). a. Repeat step 2 (assign each point to the nearest mean)
Visualization of K-Means 4. Repeat steps 2 & 3 until the “means” stop moving (convergence). a. Repeat step 2 (assign each point to the nearest mean)
Visualization of K-Means 4. Repeat steps 2 & 3 until the “means” stop moving (convergence). a. Repeat step 2 (assign each point to the nearest mean) b. Repeat step 3 (recompute means)
Visualization of K-Means Quiz: Where will the means be after the next iteration? 4. Repeat steps 2 & 3 until the “means” stop moving (convergence). a. Repeat step 2 (assign each point to the nearest mean) b. Repeat step 3 (recompute means)
Visualization of K-Means Answer: Where will the means be after the next iteration? 4. Repeat steps 2 & 3 until the “means” stop moving (convergence). a. Repeat step 2 (assign each point to the nearest mean) b. Repeat step 3 (recompute means)
Formal Description of the Algorithm Input: • X11, …, X1N; … ; XM1, …, XMN • K Output: Y1; …; YM, where each Yi is in {1, …, K}
Formal Description of the Algorithm • Init: For each k in {1, …, K}, create a random point Ck • Repeat until all Ck remain the same: Assignment (aka Expectation): For each Xi, let C[Xi] the k value for the closest Ck to Xi Update (aka Maximization): For each Ck, let Dk{Xi |C[Xi] = k} (set of Xi assigned to cluster k) if |Dk| = 0, let Ck random new point else let Ck (average of points in Dk) 3. Return C[Xi] for each Xi
Evaulation metric for K-means LOSS Function (or Objective function) for K-means: Within-cluster-sum-of-squares loss (WCSS): WCSS(X1, …, XM, C1, …, CK)
Complexity of K-Means Finding a globally-optimal solution to WCSS is known to be an NP-hard problem. K-means is known to converge to a local minimum of WCSS. K-means is a “heuristic” or “greedy” algorithm, with no guarantee that it will find the global optimum. On real datasets, K-means usually converges very quickly. Often, people run it multiple times with different random initializations, and choose the best result. In some cases, K-means will still take exponential time (assuming P!=NP), even to find a local minimum. However, such cases are rare in practice.
Quiz Is K-means Classification or Regression? Generative or Discriminative? Parametric or Nonparametric?
Answer Is K-means Classification or Regression? - classification: output is a discrete value (cluster label) for each point Generative or Discriminative? - discriminative: it has fixed input variables and output variables. Parametric or Nonparametric? - parametric: the number of cluster centers (K) does not change with the number of training data points
Quiz Is K-means Supervised or Unsupervised? Online or batch? Closed-form or iterative?
Answer Is K-means Supervised or Unsupervised? - Unsupervised Online or batch? - batch: if you add a new data point, you need to revisit all the training data to recompute the locally-optimal model Closed-form or iterative? -iterative: training requires many passes through the data
Quiz Which of the following problems might be solved using K-Means? Check all that apply. For those that work, explain what the inputs and outputs (X and Y variables) would be. • Segmenting an image • Finding galaxies (dense groups of stars) in a telescope’s image of the night sky • Identify different species of bacteria from DNA samples of bacteria in seawater
Answer Which of the following problems might be solved using K-Means? Check all that apply. For those that work, explain what the inputs and outputs (X and Y variables) would be. • Segmenting an image: Yes. Inputs are the pixel intensities, outputs are segment labels. • Finding galaxies (dense groups of stars) in a telescope’s image of the night sky. Yes. Inputs are star locations, outputs are galaxy labels • Identify different species of bacteria from DNA samples of bacteria in seawater. Yes. Inputs are gene sequences, outputs are species labels.