Download
1 / 29
290 likes | 387 Vues
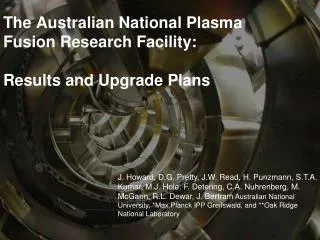
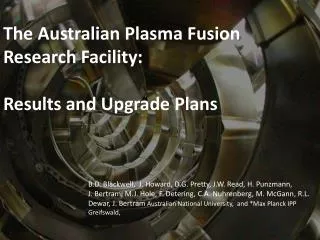
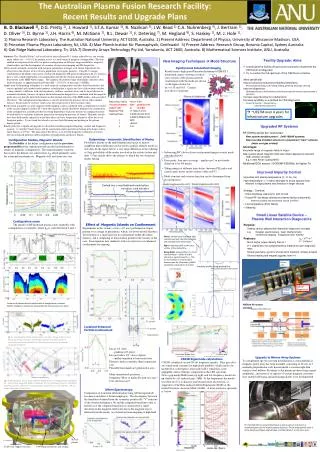
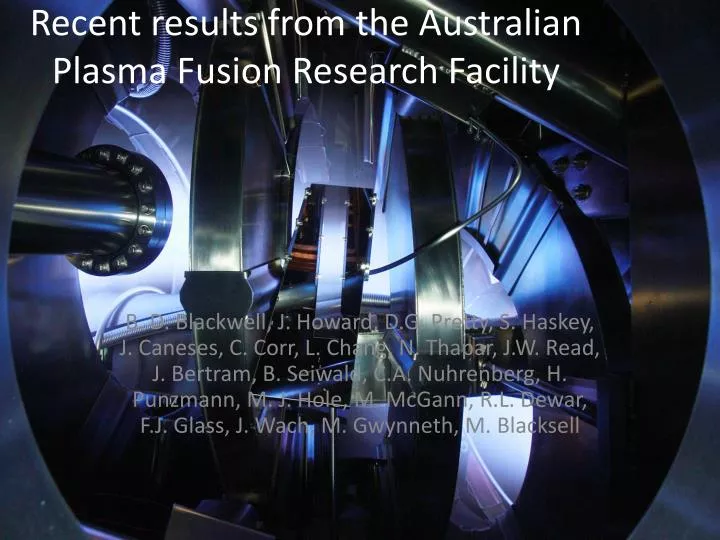
Recent results from the Australian Plasma Fusion Research Facility.

E N D
Recent results from the Australian Plasma Fusion Research Facility B. D. Blackwell, J. Howard, D.G. Pretty, S. Haskey, J.Caneses, C. Corr, L. Chang, N. Thapar, J.W.Read, J. Bertram, B. Seiwald, C.A. Nuhrenberg, H. Punzmann, M. J. Hole, M. McGann, R.L. Dewar, F.J. Glass, J. Wach, M. Gwynneth, M. Blacksell
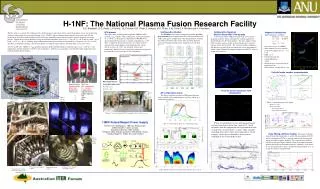
The Australian Plasma Fusion Facility: Results and Upgrade Plans The Facility The Upgrade (2010-2013) Result Overview: H-1NF Data mining Alfvénic Scaling Optical Measurements Radial Structure MDF Results Aims Key areas New diagnostics for Upgrade Conclusions/Future
H-1NF: the Australian Plasma Fusion Research Facility Originally a Major National Research Facility established by the Commonwealth of Australia and the Australian National University Mission: • Detailed understanding of the basic physics of magnetically confined hot plasma in the HELIAC configuration • Development of advanced plasma measurement systems • Fundamental studies including turbulence and transport in plasma • Contribute to global research effort, maintain Australian presence in the field of plasma fusion power MoU’s for collaboration with: Members of the IEA implementing agreement on development of stellarator concept. National Institute of Fusion Science of Japan, Princeton Plasma Physics Lab Australian Nuclear Science and Technology Organisation
Major radius 1m • Minor radius 0.1-0.2m • Magnetic Field 1 Tesla (0.2 DC) • q 0.5 -1 (transform 1~2) • ne 1-3x10¹⁸ • Te 20eV (helicon) <200eV (ECH) • 0.01 - 0.1% H-1 CAD
The Facility Upgrade • Australian Government’s “Super Science Package” • Boosted National Collaborative Infrastructure Program using the “Educational Infrastructure Fund” • $7M, over 4 years for infrastructure upgradesRF heatingvacuum and power systems, diagnosticscontrol data access(no additional funding for research) 2009Australian Budget Papers
New cooled RF Antenna – helicon/ICRF • Insulators/ • Vacuum feed through Tuning box Antenna contoured to plasma shape
Diagnostic and Control Upgrades Synchronous Imaging Coherence Imaging Camera Multichannel Interferometer MDF Imaging
Powerful web-based data browser • Low bandwidth required, open source • Full data resolution accessible • Same access for binary xml csv forms • firewall issuesviewer software Screenshot of web browser at http://h1ds.anu.edu.au/mdsplus/H1DATA/58063/TOP/OPERATIONS/MIRNOV/A14_14/INPUT_2 Screenshot of web browser at http://h1ds.anu.edu.au/mdsplus/H1DATA/58063/TOP/OPERATIONS/MIRNOV/A14_14/INPUT_2/
H-1 configuration is very flexible • “flexible heliac” : helical winding, with helicity matching the plasma, 2:1 range of twist/turn • H-1NF can control 2 out of 3 oftransform () magnetic well and shear (spatial rate of change) • Reversed Shear like Advanced Tokamak mode of operation low shear = 4/3 twist per turn (transform) = 5/4 medium shear Edge Centre
Shaun HaskeyDavid Pretty Mirnov Array 1 Mirnov Array 220 pickup coils Interferometer RF Antenna 0.2m Three Mirnov Arrays (Toroidal) • New Toroidal Array • Coils inside a SS thin-wall bellows (LP, E-static shield) • Access to otherwise inaccessible region with • largest signals and • with significant variation in toroidal curvature.
Flucstruc analysis via SVD phase vs Singular vectors are grouped by similarity to separate simultaneous modes Follows plasma shape, amplitude variation is much less Helical Array resolves n and m, but not independently e.g. 9/7,8/7,7/6 sim. Chronos Singular Values Time (ms) PSD of chronos Topos
Shaun HaskeyDavid Pretty Phase Clustering Separates Modes 0 50 100kHz Observedfrequency K|| after correctionfor ne Spread decreases Clusters lies close to k||cyl. for expected n,m apart from a factor of ~3 (iotabar taken along solid line) f (kHz) 0 0.1 k|| (rad/m) rational surfaces zero shear
Mode Physics? • Unclear drive physics • Alfvén ~5e6 m/s – in principle, ICRH accelerates H+ ions but poor confinement of H+ at VA (~40keV) makes this unlikely. • More complete analysis of orbits with H-1 parameters (Nazikian PoP 2008) reduces required ion energy considerably • H+ bounce frequency of mirror trapped H+ is correct order? • Electron energies are a better match, but the coupling is weaker. (mechanism?) res = k||VAlfvén = k||B/(o) Numerical factor of ~ 1/3 required for quantitative agreement near resonance • Impurities (increased effective mass) may account for 15-20% Density fluctuations acoustic? As k|| 0, the mode is expected to become more “sound-like” b~llincreases as 0 b~ perp b~ parallel b~ perp
Jason Bertram Matthew Hole CarolinNuhrenberg CAS3D Studies • Bumpiness (mirror) term in H-1 field requires hundreds of Fourier components to represent parallel displacement. • This gives rise to a dense sound mode population in the range of interest (0-100kHz) – which interact with the shear modes. • There are global modes here due to the finite beta gap (BAE) • Such modes can exhibit a similar but weaker frequency dependence as our “whale tails” if the temperature profile is very hollow. Can be resolved by: B scan or polarization study
Optical Imaging of Internal Mode Structure John HowardNandika ThaparJesse Read Calibrating View Geometry with eBeams Field lines from accurate magnetic model (red) are matched with ebeam images (black) • Intensity proxy for ne • CCD camera captures vertical view of plasma light, synchronisedwith the Mirnov signals, averagedover many cycles. • Phase locked loop waveforms
J. Howard: Synchronous Imaging of MHD Modes in H-1 Vertical view of plasma light synchronised with the Mirnov signals and averaged over many cycles. Left: Intensity profile at the cross-section of the dashed line Right: CAS-3D MHD code prediction of electron density. J. Howard, J. Read, J. Bertram , B. Blackwell Howard, APFRF Facility and MDF – ANSTO 2010
Synchronous imaging configuration scan Poloidal mode structure agrees with magnetic data on both sides of both 5/4 and 4/3 resonances Mode appears to be located at outer minor radii HeI 668
Doppler Coherence Imaging on H-1 Raw spatial heterodyne image (0.1T Argon) Interference fringes encode: • velocity phase (shift) • temperature contrast Results: • Ion temperature is hollow (10-25eV) • Rigid rotation of +/- 3km/sec at outer radii • Reflections from TF coils some degradation
Gas Puff Imaging of coherent fluctuations in H-1 John HowardJesse Read Supersonic nozzle (Ne injection) GPI: dI / I Movie of plasma oscillation showing an Alfvénic MHD mode View of plasma through H-1 porthole
Materials Diagnostic Test Facility Conditions approaching edge of Fusion reactor • Explore effects of plasma on advanced refractory materials • Joint ANU-ANSTO + USyd, UNew.++ • Directly related to Gen 4 nuclear, high temperature coal, solar • Uses H-1 power systems, diagnostics MDF Prototype operational in new lab
Cormac CorrJuan CanesesCameron Samuel MDF Plasma Parameters (low power) Argon 1019/m3 3eV (Power density destroys probes above this) H 1018/m3 (first tests~1kW) 5kW available, 20kW (2013) dynamic tuning (100us) tried for Ar+ blue core niAr - 1400W Te Ar – 1400W Visible Spectra Ar 200W Ar low pwr Ar“blue core” Ar+ 440-488 ni H 1200W Ha H Hb
John HowardRomana Lester Doppler Coherence Imaging of the MDF helicon source 3mT Argon in MDF: Composite images of brightness and azimuthal flow speeds • Follows field lines • ~rigid rotation 1km/s • Ti <1eV on axis, rising at the edge antenna target region Composite images of the brightness, azimuthal flow speed and argon ion temperature in the magnetic mirror region of the MDF device (3.0 mTorr)
Juan CanesesLei Chang Helicon waves in MDF • m = +1 circularly polarised wave as expected (k|| hard to match - below) • Attenuation lengths of 8cm – 24cm (in Ar) • Amplitude measurements and simulations indicate power is transported to target by parallel flows rather than wave propagation. • Density increase less than expected for flux conservation (esp. in Ar) K|| match requires ne to increase axially 5mm
Modelling with the UT/ORNL codes Lei Chang Juan Caneses Radial wave profiles in reasonable agreement – usually requires ~10ei Further work required matching ne profiles in (r,z) with experiment
Future Research • Use all 3 axes of the Toroidal Mirnov Array polarisation • Bayesian MHD Mode Analysis • Toroidal visible light imaging (Neon, He) • Correlation of multiple visible light, Mirnov and n~ e data • Spatial and Hybrid Spatial/Temporal Coherence Imaging • Island, chaotic and open field line physics • Plasma Surface Interaction physics Facility upgrade • Improve facilities for developing divertor and edge diagnostics • Study stellarator islands, divertors, baffles e.g. 6/5 island divertor • Develop “plasma wall interaction” diagnostics • Increase Power /Field on Materials Diagnostic Facility (H-1 power sys) • multiple plasma sources, approach ITER edge